
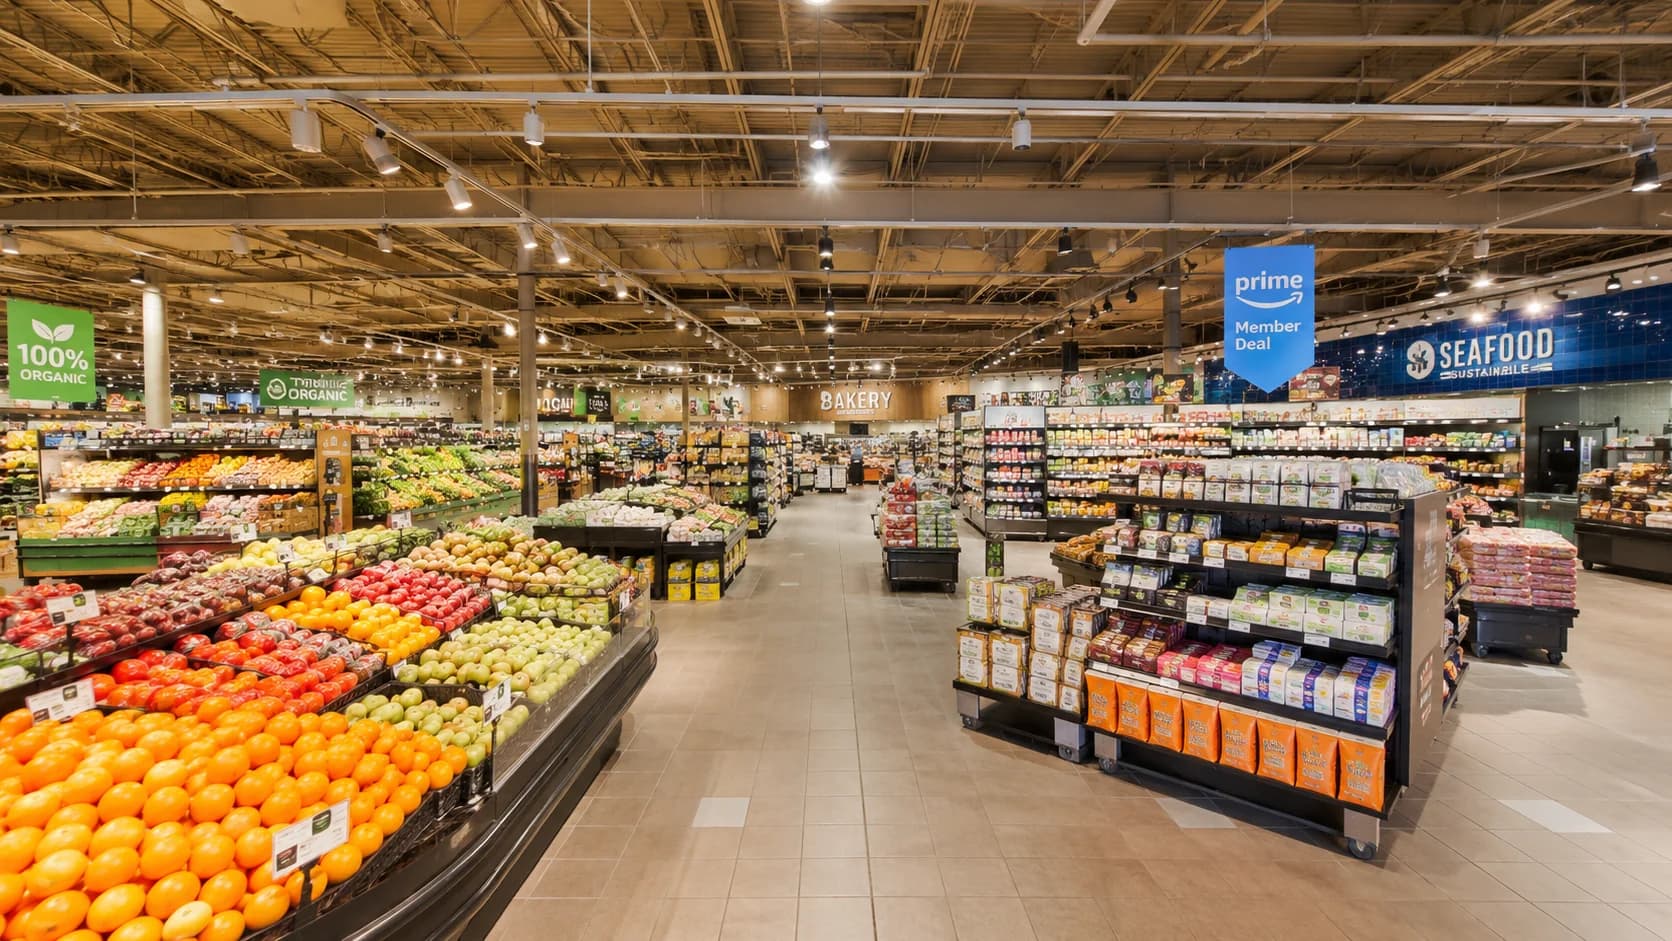
Supermarket Analytics &
AI People Counting
AI-powered supermarket analytics: people counting for grocery stores, foot traffic analysis, and retail heatmap optimization. Reduce friction, maximize basket size, and give shoppers a reason to come back.
Every Minute of Waiting Is Lost Revenue
Supermarkets run on thin margins and high volume. Every bottleneck, every empty promo zone, every blind spot on the floor costs you sales.
Checkout Bottlenecks
Frustrated shoppers abandon full carts at long checkout lines. You need to open lanes before congestion forms — not after the damage is done.
Promo Zone Failures
End-caps and promotional islands are expensive real estate. If shoppers walk past them without stopping, you’re losing margin on every square foot.
Shrinkage Blind Spots
Inventory loss occurs in blind spots. Correlating traffic spikes with stock data helps identify risk areas and improve loss prevention.
How xRetail Optimizes Your Supermarket
From entrance analytics to checkout optimization — every touchpoint becomes a data point.
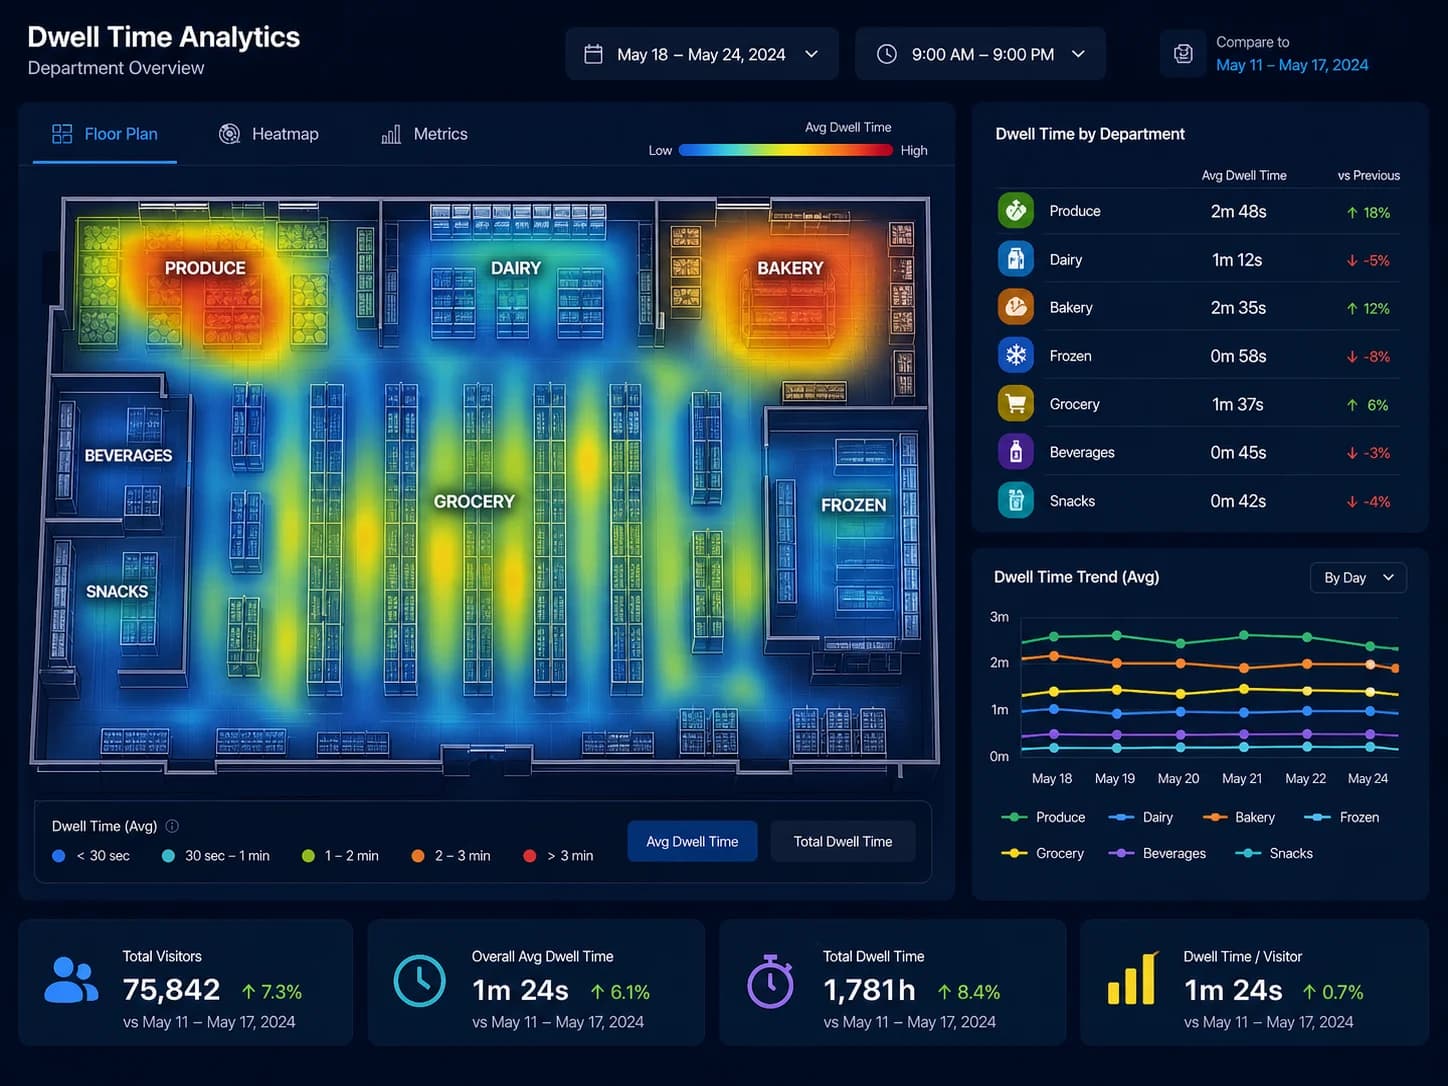
Dwell Time Analytics
xTrack measures how long shoppers spend in each department. Identify high-engagement zones and optimize product placement for maximum basket impact.
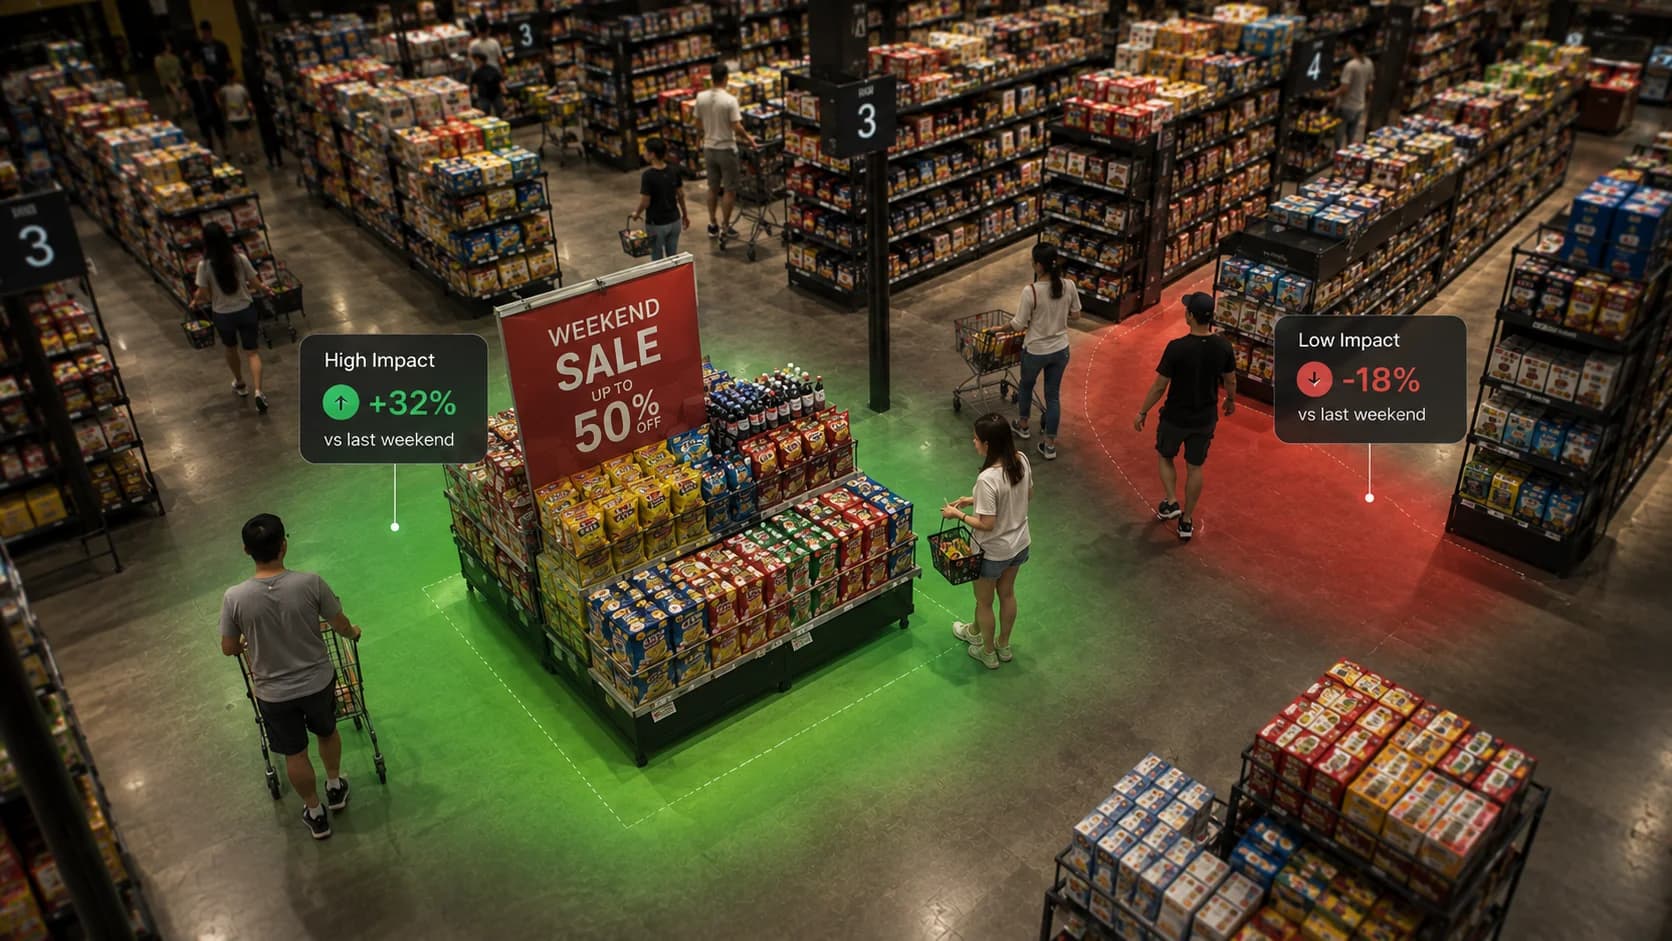
Promo Effectiveness
Measure exactly how many shoppers stopped at each display. Compare promo zone dwell times with basket data to prove ROI.
Basket Analytics
Correlate foot traffic patterns with POS transaction data. Identify which aisles drive the most revenue per visitor.
Staff Optimization
Peak-hour predictions based on historical data help you schedule the right number of cashiers, stockers, and floor staff.
Know Where Shoppers Spend Their Time
Not all foot traffic is equal. xTrack Dome cameras measure exactly how long shoppers spend in each department — from the fresh produce section to the dairy aisle. Identify which zones drive the most engagement and which areas need layout improvements.
- Department-level dwell time heatmaps
- Identify high-engagement vs. pass-through zones
- Correlate dwell time with basket size per department
Measure What Actually Works
Did that weekend sale actually drive more foot traffic? xRetail correlates entry counts with POS basket size data, showing you exactly which promotions worked, which aisles drove the most revenue, and which displays shoppers completely ignored.
- Correlate footfall with transaction volume
- Identify high-traffic "hot zones" for premium displays
- A/B test promotional layouts with data, not guesses
Optimize the Path to Purchase
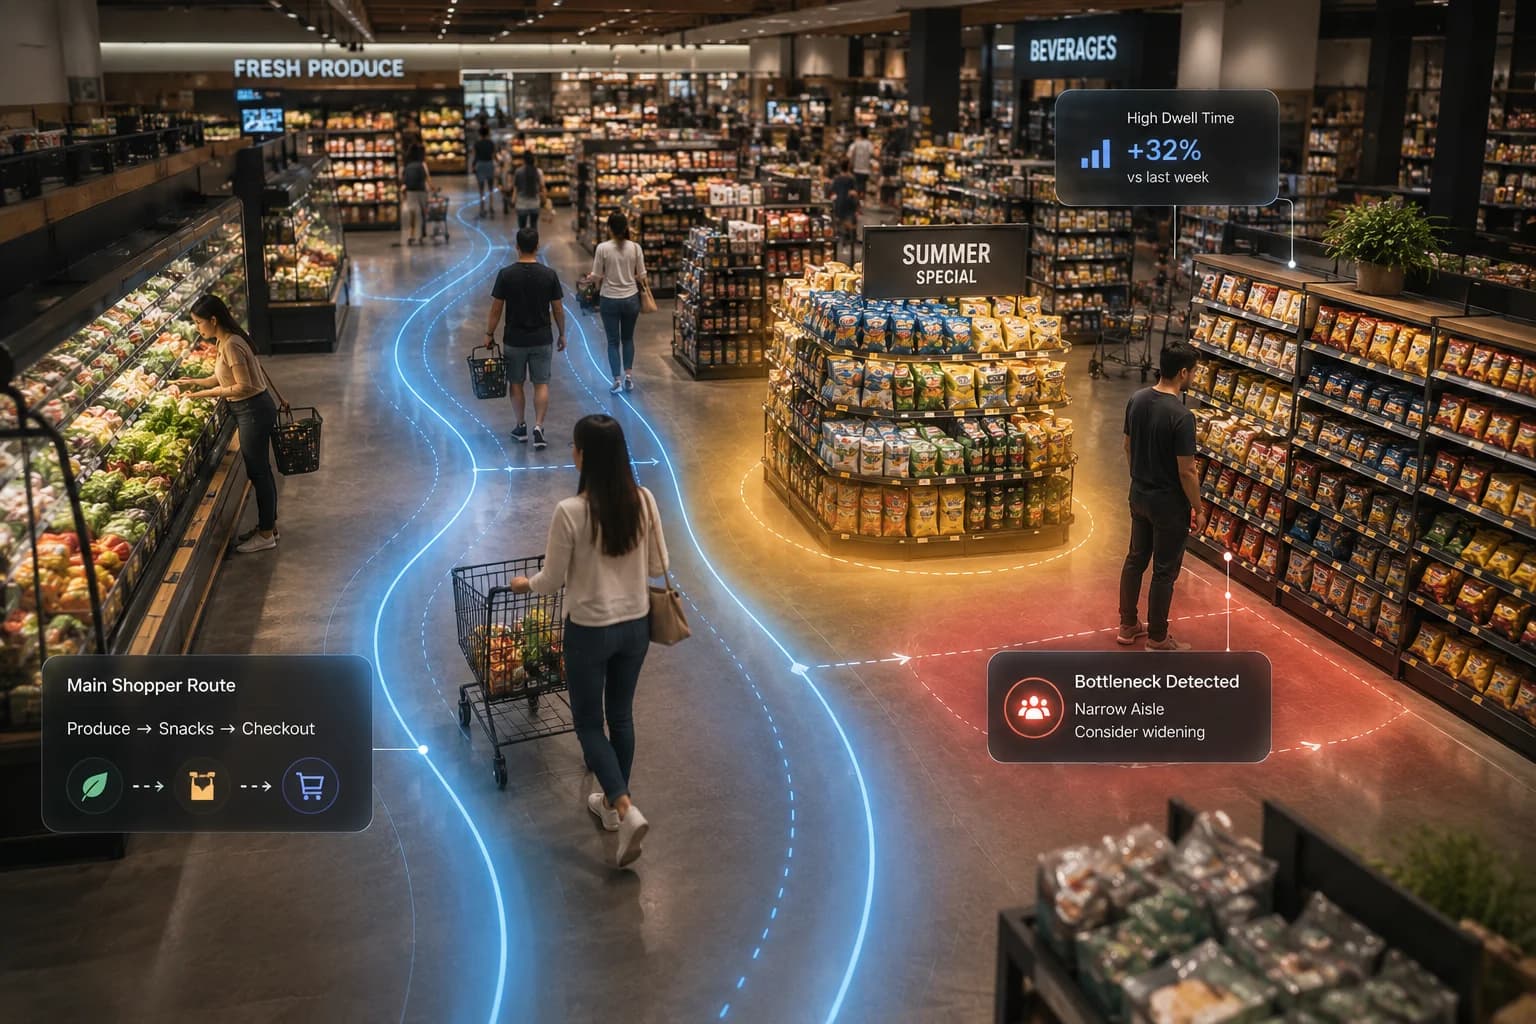
Heatmaps reveal the most common routes shoppers take through your store. Use this data to place complementary products along high-traffic paths, eliminate bottlenecks in narrow aisles, and design layouts that naturally guide customers to high-margin sections.
- Full-store heatmap visualization
- Dwell time analysis per department
- Entrance-to-exit path tracking
Built for Every Grocery Format

Hypermarkets
Large-format stores use xTrack heatmaps to optimize department layouts, track inter-department crossover patterns, and measure the impact of seasonal promotional zones across vast floor spaces.
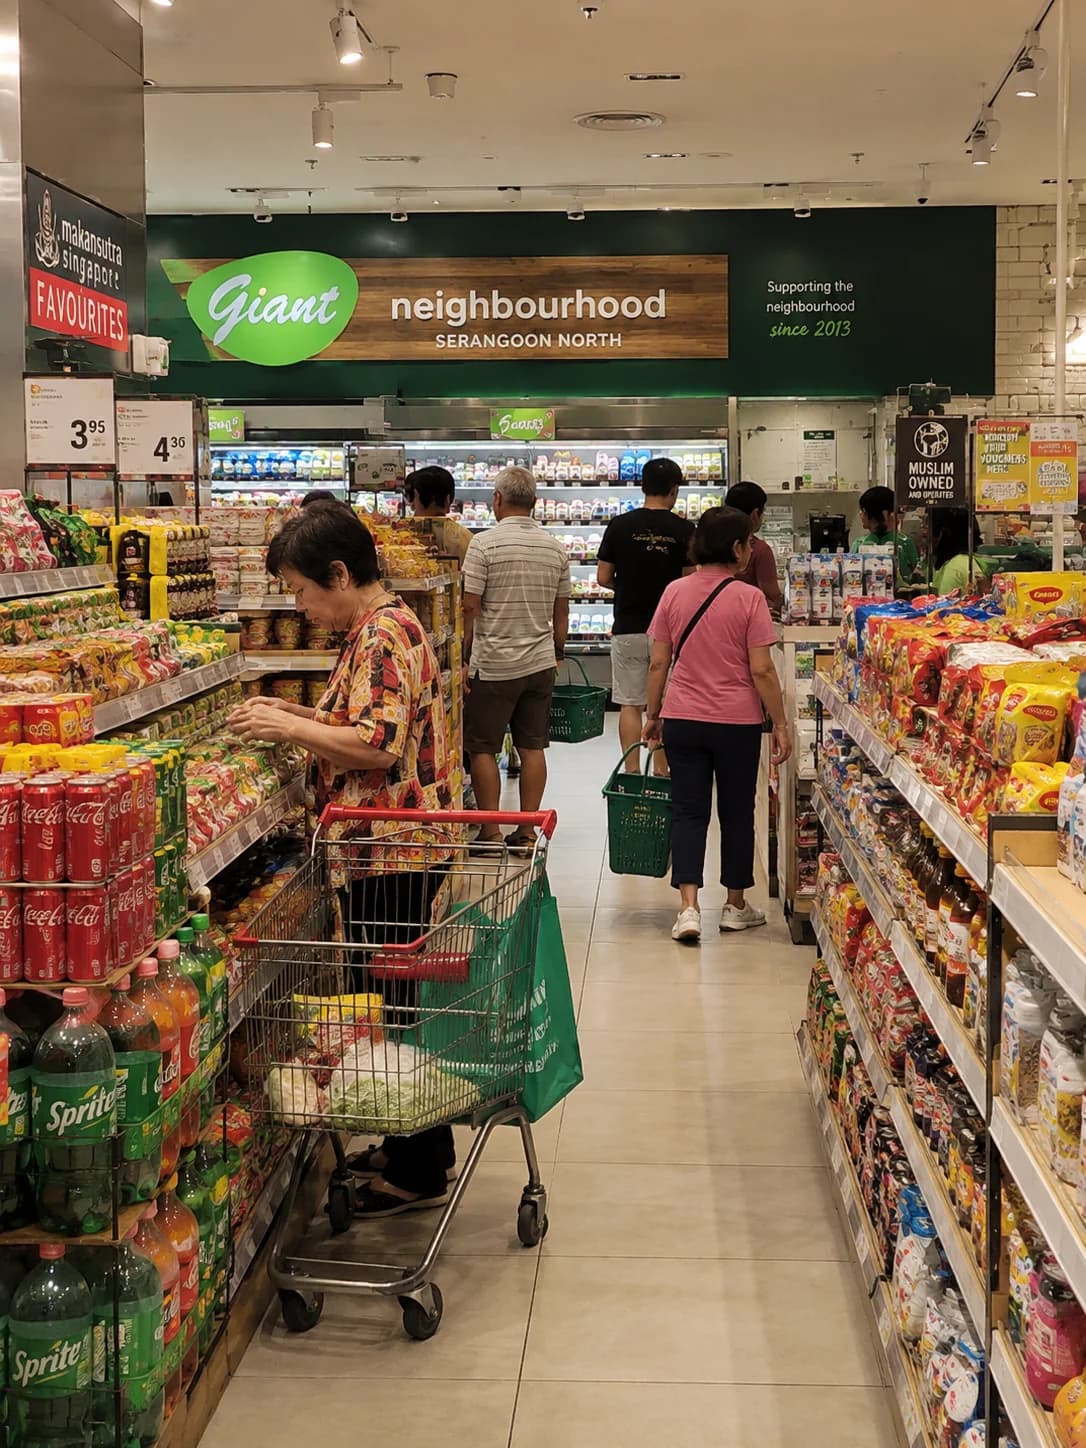
Neighborhood Markets
Smaller formats focus on dwell time optimization and basket size optimization. Real-time occupancy monitoring and promo analytics maximize limited display space.

Grocery Chains
Vortex Cloud lets regional managers compare performance across dozens of stores — identify best practices, standardize layouts, and deploy resources where they’ll have the most impact.
Your Supermarket Toolkit
Optimize your grocery store operations from entrance to checkout.

xTrack Dome
Shopper flow analysis, dwell time measurement, and real-time occupancy insights for store optimization.
View Details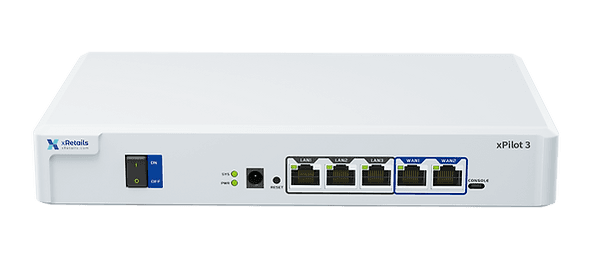
xPilot 3 Gateway
Reliable connectivity for POS systems, inventory scanners, and self-checkout kiosks.
View Details
Vortex Cloud
Centralized dashboard for multi-site grocery performance comparison and trend analysis.
View DetailsReady to Optimize Your Supermarket?
Talk to our industry experts about how xRetail can transform your grocery operations — from a single neighborhood store to a national chain.
Get Started Today