Passerby Capture Rate: The Most Overlooked Metric in Retail Performance
Retailers spend a great deal of time optimising what happens inside their stores. Layout changes, staff training, inventory placement, queue management, checkout flow — every element of the in-store experience gets measured, tested, and refined. But there is one metric that most retailers never track, and it is the one that determines whether all of that optimisation ever gets a chance to work: the passerby capture rate.
Passerby capture rate is the percentage of people who walk past a store and choose to walk in. It is the first and most fragile step in the conversion funnel. If only 5% of passersby enter, then even the best in-store conversion rate is operating on a fraction of the available traffic. A store that doubles its capture rate from 5% to 10% doubles its potential customer base without spending a dollar on advertising.

xTrack
AI-powered shopper intelligence for retail chains
Learn More →The fact that most retailers cannot name their passerby capture rate is revealing. It suggests that storefront performance is managed on instinct rather than data. Window displays are changed based on what the visual merchandising team thinks looks good, not on whether they actually pull people through the door.
Why Passerby Capture Matters More Than You Think
Consider two stores on the same street with identical footprints, staffing levels, and product ranges. Store A has a passerby capture rate of 8% and an in-store conversion rate of 25%. Store B has a capture rate of 4% and an in-store conversion rate of 30%. Which store performs better?
Store A generates 2,000 passersby per day, so 160 people walk in and 40 make a purchase. Store B sees 3,000 passersby per day, so 120 people walk in and 36 make a purchase. Despite the lower in-store conversion rate, Store A outperforms Store B because it captures more of the available foot traffic.
This example illustrates a principle that applies across retail formats. In-store conversion rates typically vary within a narrow band — from 20% to 40% for most store types. But passerby capture rates vary enormously, from under 2% for stores with poor storefront visibility to over 15% for stores with high-visibility locations and effective window displays. The biggest lever for revenue growth is not in-store conversion optimisation. It is getting more of the people who walk past to walk in.
What Drives Passerby Capture
Several factors determine whether a passerby becomes a visitor. The most important is visibility. Stores located on corners or with wide frontages naturally capture more attention. But for stores in standard retail strips or shopping centres, the window display is the primary draw. Research consistently shows that stores with clearly defined, well-lit window displays that communicate a specific product category or promotion see capture rates 40-60% higher than stores with cluttered or generic displays.
Sight lines from the street into the store also matter. Shoppers are more likely to enter a store where they can see into the interior — products on display, staff presence, lighting, and activity inside the store. Stores that block sight lines with high shelving near the entrance or opaque window treatments discourage spontaneous entry.
Entry threshold is a third factor. A clear, unobstructed entrance with a visible welcome area signals an easy transition from street to store. Multiple steps up, narrow doorways, or cluttered entry zones create physical and psychological resistance to entry. The simpler the path from sidewalk to sales floor, the higher the capture rate.
Measuring Passerby Capture with AI
Until recently, measuring passerby capture required manual counters at the door or grainy CCTV footage reviewed after the fact. Neither approach is practical for ongoing measurement across multiple stores. Manual counts are expensive and inconsistent. CCTV review is time-consuming and reactive.
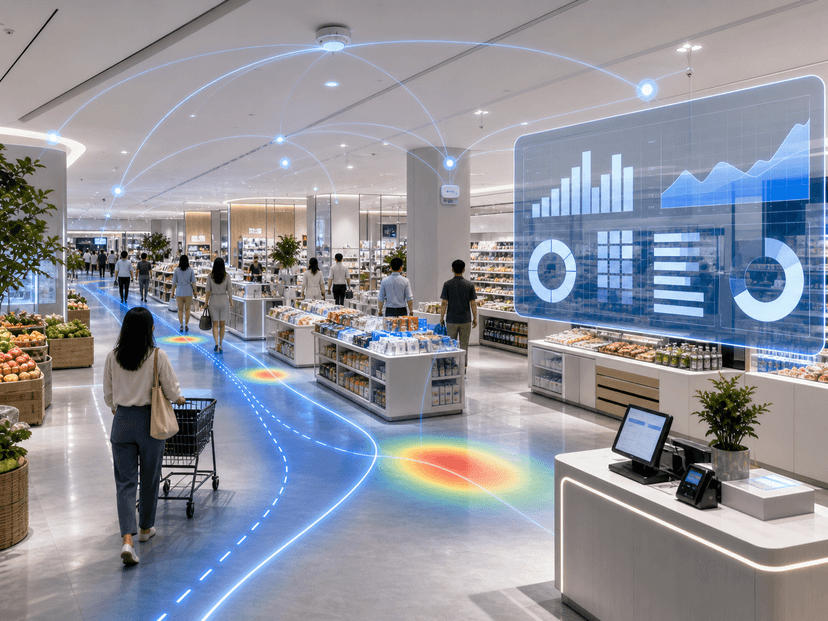
AI-powered footfall analytics solve this problem. Modern AI cameras can simultaneously count passersby on the street and visitors entering the store, then calculate the real-time capture rate automatically. No manual counting, no footage review, no delays. Store managers can see their capture rate on a dashboard alongside other performance metrics and track changes in response to window display updates, signage changes, or promotions.
These systems also provide a second critical data point: directional passersby counts. Not all passersby are equal. People walking towards a store from one direction may have a different capture rate than those walking from the other direction. This information helps retailers optimise the placement of window displays and directional signage to match the most common approach path.
From Metric to Action
Once a retailer begins tracking passerby capture rate, the data drives practical improvements. The most common finding is that capture rate varies significantly by time of day. A store that captures 8% of passersby during lunch hours may capture only 3% in the late afternoon. This pattern often correlates with lighting — window displays that are effective in bright daylight may look uninviting as the light shifts.
Seasonal and promotional correlation is another valuable insight. Capture rate spikes during specific promotions or window display cycles, providing a direct ROI measure for visual merchandising investments. When a window display costs $2,000 to produce but generates an additional $15,000 in sales over six weeks through improved capture, the business case is clear.
At the portfolio level, passerby capture rate becomes a site selection and lease negotiation tool. A location with high passerby traffic but low capture may justify investment in better storefront design or signage. A location with both low passerby traffic and low capture may be fundamentally unsuitable for the format, informing lease renewal decisions with data rather than gut feel.
A Blind Spot Worth Fixing
Passerby capture rate is not a vanity metric. It is a direct measure of how effectively a store converts its most abundant and cheapest resource — the people already walking past — into paying customers. For most retail chains, improving passerby capture by a few percentage points has a larger impact on revenue than any in-store optimisation they are currently pursuing.
The technology to measure capture rate is mature, affordable, and deployable in hours. The cameras are the same edge-AI devices used for in-store footfall analytics. No separate infrastructure is needed. The data is available on the same dashboard, alongside dwell time, conversion rate, and queue metrics. Adding passerby capture to the standard retail performance dashboard costs nothing beyond the initial installation and provides a return through better storefront decisions that compounds over time.
For retailers serious about understanding every step of the customer journey, passerby capture is the missing first step. To learn how xTrack helps retail chains measure passerby capture rate alongside in-store footfall analytics, book a pilot or visit the xTrack product page.
Related Articles
Continue exploring insights from xRetail
Why Smart Stores Need More Than Analytics: The Case for a Connected Retail Operations Stack
July 3, 2026
Data to Action: How Singapore Retail Chains Turn Footfall into Insights
July 3, 2026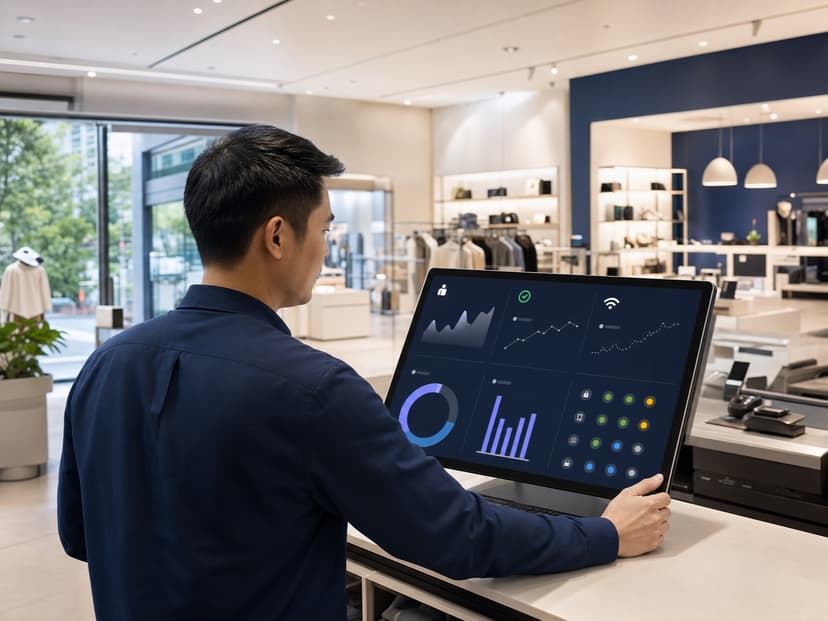
Operational Data Integration Is the Missing Layer in Retail AI Adoption
July 3, 2026Ready to Transform Your Retail Operations?
Discover how xRetail\' AI-powered IoT management and shopper analytics platforms can help your business reduce costs, increase revenue, and stay ahead of the competition.
Contact Our Team