
One View of Every Store: How Unified Operations Dashboards Give APAC Retail Leaders Real-Time Control
A unified retail operations dashboard is no longer just a reporting layer for head office. For multi-store retail teams in Singapore and APAC, it is becoming the control layer that connects what is happening inside every store with the decisions that operations leaders need to make today.
The pressure is practical. Retailers are managing rising operating costs, manpower constraints, stronger e-commerce competition, and more complex store technology. Singapore's refreshed Retail Industry Digital Plan, launched by Enterprise Singapore and IMDA on 26 May 2026, specifically frames technology adoption around business touchpoints and the operational realities retailers face, including cost pressure and manpower limitations. The accompanying factsheet reports that 88 percent of relevant retail enterprises are keen to adopt at least one sector-specific solution in 2026.
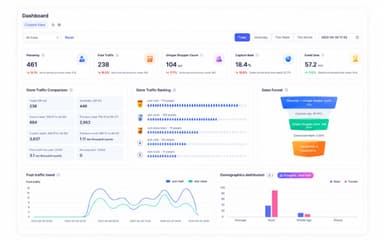
Vortex Cloud
Unified real-time dashboard for store operations, shopper intelligence, device health, and network resilience
Learn More →At the same time, retail AI investment is moving from experimentation into daily operations. NVIDIA's 2026 retail and CPG AI survey reports that 91 percent of respondents are actively using or assessing AI, 90 percent plan to increase AI budgets in 2026, and 47 percent are using or assessing agentic AI in operations. Gartner's retail digital transformation guidance also points to AI as a top technology priority for retail IT leaders by 2026, while its 2026 store execution research highlights the need to orchestrate workflows, validate store data, and define guardrails before automation can be trusted.
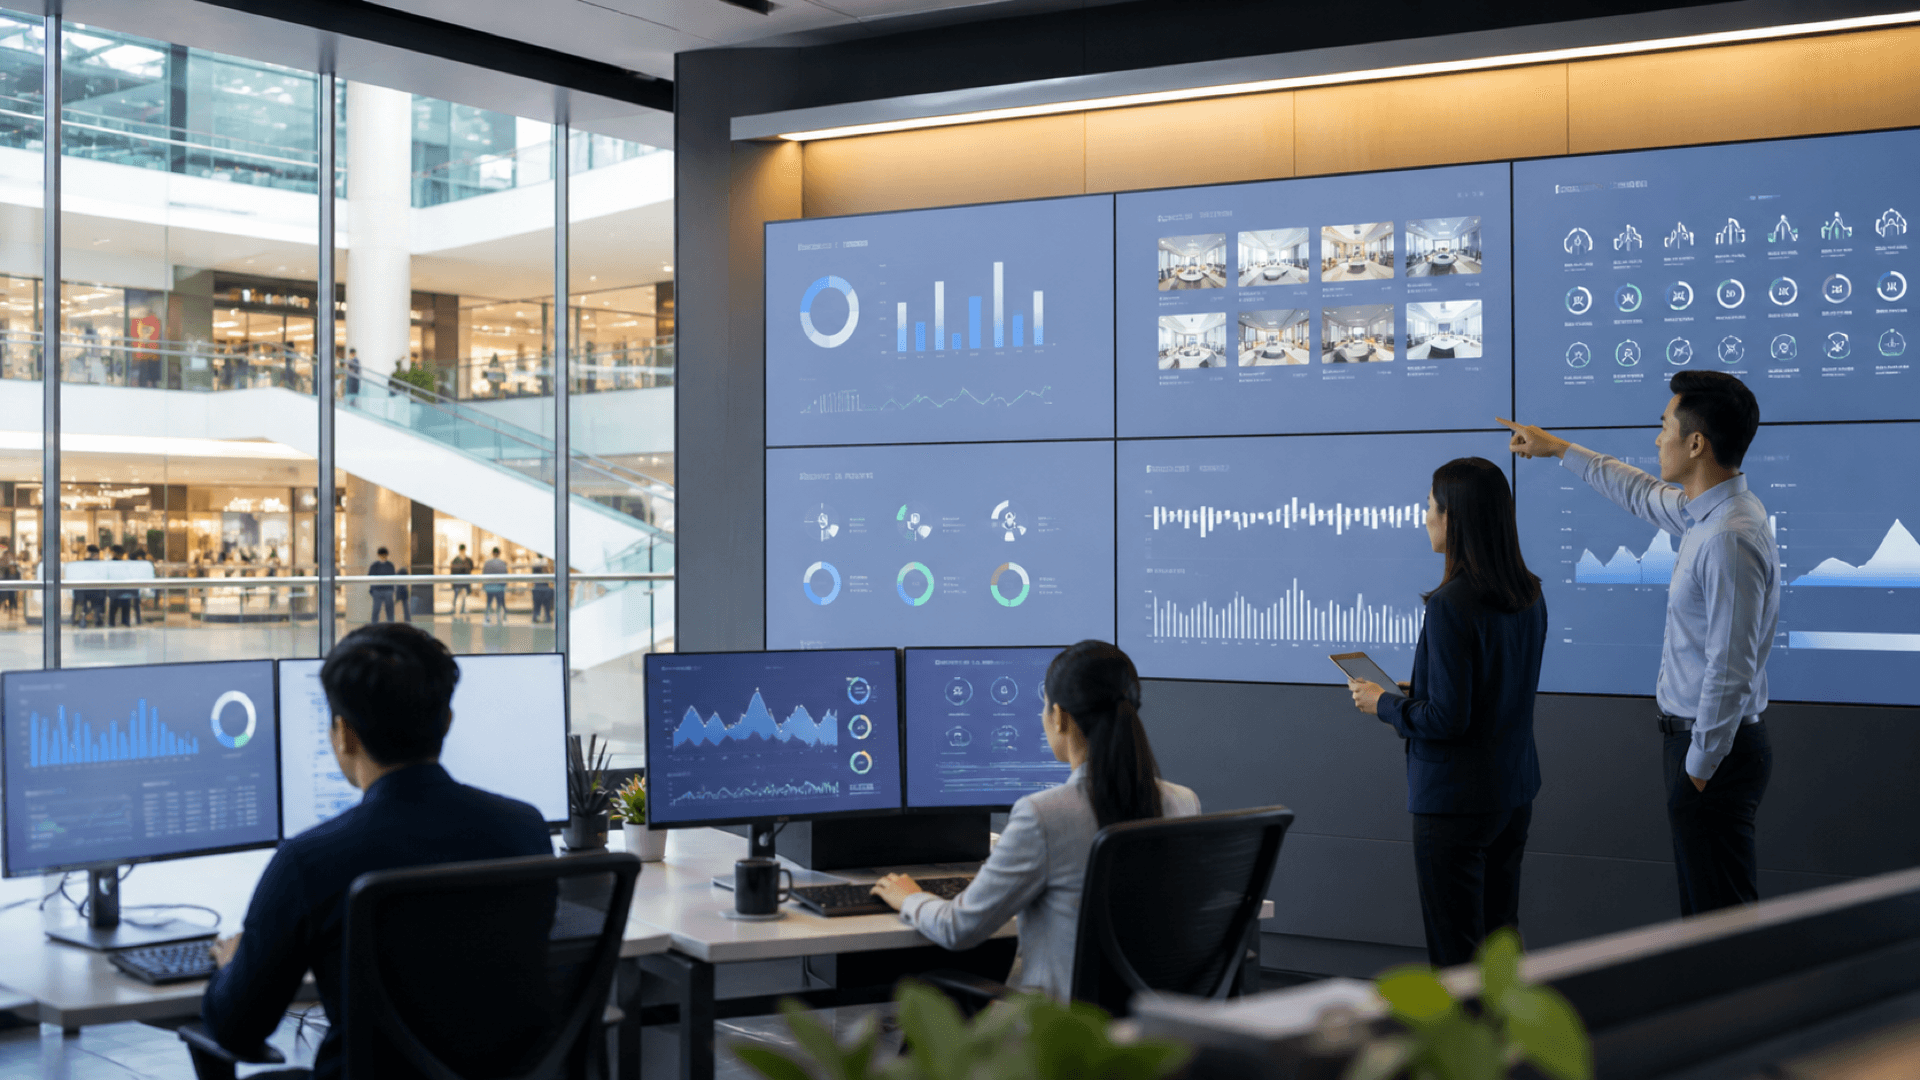
The message for APAC retail leaders is clear: AI and analytics only matter if they improve daily decisions. A multi-store analytics dashboard should help teams see the truth of each store quickly, compare performance consistently, and respond before small problems become regional patterns.
From reports to real-time store control
Many retail teams already collect store data. The problem is that the data is often fragmented. Footfall may sit in one report. Sales may sit in another. Device status may be checked only when a store calls for support. Network resilience may be treated as an IT concern until payments, POS access, or connected devices are affected. Store managers may know what happened locally, while regional leaders see the issue only after the day is over.
That delay creates operational blind spots.
A store may have high sales because traffic was unusually strong, not because conversion improved. Another location may appear weak in revenue but actually have a healthy traffic-to-sales conversion rate and a footfall problem. A service area may be congested during predictable parts of the day. A campaign display may attract dwell time but fail to move customers deeper into the store. A device may be offline, causing missing store performance data that no one notices until weekly reporting.
A unified retail operations dashboard changes the operating rhythm. Instead of asking teams to reconcile disconnected systems, it gives head office, regional managers, and store operations teams one real-time view of store performance, customer flow, and infrastructure health.
For xRetail Solutions, this role is served by Vortex Cloud: a unified real-time dashboard for store operations. It becomes more valuable when connected with xTrack for AI shopper intelligence and xPilot 3 Pro for retail network resilience.
What a unified retail operations dashboard should show
The strongest dashboards are not built around vanity charts. They are built around operational questions.
For a retail operations director, those questions may include which stores are overperforming or underperforming against comparable locations, whether a weak sales day is caused by lower footfall or lower conversion, which stores are seeing rising occupancy or congestion in key areas, which zones attract customer attention, whether store devices are online and reporting consistently, and where regional teams should focus attention today.
To answer those questions, a store KPI dashboard should bring together four categories of visibility: shopper intelligence, multi-store performance comparison, device health monitoring, and network resilience.
First, shopper intelligence. xTrack provides footfall counting, people counting, dwell time, conversion rates, zone analysis, occupancy monitoring, and shopper journey insights. This helps retailers move beyond sales-only reporting and understand how customers actually behave in the store.
Second, multi-store performance comparison. Regional leaders need a consistent way to compare stores across Singapore, Southeast Asia, and APAC. A dashboard should make it easier to see whether a store's issue is local, format-specific, seasonal, or part of a broader regional trend.
Third, device health monitoring. Store operations depend on connected devices, sensors, gateways, and in-store systems. When device status is invisible, operational teams may not know whether a store's data reflects reality or a technical gap.
Fourth, network resilience. xPilot 3 Pro provides 5G multi-WAN failover and retail network resilience. For connected retail environments, store visibility depends on keeping networked systems reachable and manageable, especially across distributed sites.
Why footfall and conversion need to be viewed together
Sales data tells retailers what was bought. It does not explain how many people entered, where they moved, how long they stayed, or where attention was lost.
This is why real-time footfall data matters. For APAC retailers managing multiple locations, footfall analytics helps separate traffic issues from conversion issues. A low-revenue store with low traffic needs a different response from a high-traffic store with weak conversion. One points toward demand generation, location context, campaign visibility, or tenant mix. The other points toward store layout, staffing, merchandising, product availability, or service execution.
When xTrack shopper intelligence is viewed inside a unified dashboard, teams can connect store traffic analytics with day-to-day decisions: adjusting staffing plans around peak traffic periods, comparing dwell time across product zones, identifying bottlenecks in customer flow, reviewing whether campaign areas attract attention, monitoring occupancy patterns across stores, and comparing traffic-to-sales conversion by location.
The goal is not to overload store teams with more reports. The goal is to help managers decide where to look, what to investigate, and which actions are most likely to matter.
For retailers searching for retail analytics Singapore or store analytics APAC, this distinction is important. Analytics should not only describe the store. It should support the operating cadence of the business.
Device health and network visibility are part of store performance
Retail operations leaders often treat store performance and store infrastructure as separate topics. In practice, they are connected.
A connected store depends on reliable devices and network access. If in-store devices are offline, data may be incomplete. If connectivity is unstable, store teams may lose access to systems that support daily operations. If regional IT teams cannot monitor devices remotely, support becomes slower and more dependent on site visits.
This is why retail IoT monitoring and device health monitoring belong inside the operations view, not only inside an IT tool. Store leaders do not need every technical detail, but they do need confidence that the data they are using is current, complete, and connected to real store conditions.
xPilot 3 Pro supports this layer by providing 5G multi-WAN failover and retail network resilience. In the context of Vortex Cloud, network health becomes part of the bigger operational picture: not a separate issue to discover after a disruption, but a visible factor in store readiness and operational continuity.
This is especially relevant for regional teams managing stores across different malls, streets, formats, and infrastructure environments. The more distributed the network, the more valuable it becomes to see store health from one control layer.
Vortex Cloud as the unified operations layer
Vortex Cloud is positioned as xRetail's unified real-time dashboard for store operations. Its role is to help retail leaders see across stores, compare performance, and connect operational signals that are often managed separately.
In a practical APAC retail environment, Vortex Cloud should be thought of as the place where three layers come together: store activity from xTrack, store infrastructure visibility including device status and retail IoT monitoring, and network resilience from xPilot 3 Pro.
This creates one view for the teams responsible for store outcomes. A CTO can understand whether the technology layer is supporting store operations. A VP Store Operations can compare performance across sites. A regional manager can spot which locations need attention. Store teams can receive more focused guidance because head office has better context.
The dashboard is not valuable because it displays more data. It is valuable because it reduces the distance between store signals and operational action.
Practical use cases for Singapore and APAC multi-store teams
Daily store performance review becomes more precise when regional leaders can compare footfall, conversion, dwell time, occupancy, and device status across locations. This helps teams distinguish between a store that needs commercial support and a store that may have missing or incomplete data.
Traffic-to-sales conversion diagnosis becomes faster when xTrack data is visible through Vortex Cloud. A store with strong traffic and weak conversion may need closer review of merchandising, staff allocation, product availability, or customer flow. A store with weak traffic but stable conversion may need a different commercial response.
Service area and congestion visibility helps teams identify where customers slow down, where service areas become congested, and where layouts may need attention. This is useful for stores with compact footprints, high peak-hour variation, or regional formats that behave differently across markets.
Store comparison across regions matters because APAC retail networks are rarely uniform. A Singapore flagship, a suburban mall store, a travel retail location, and a regional outlet may all behave differently. A multi-store analytics dashboard helps leaders compare similar stores against each other and avoid treating every location with the same operating assumptions.
Device and network readiness belongs in the same operating picture. Store analytics is only as reliable as the systems feeding it. Device health monitoring and network resilience visibility help operations and IT teams detect gaps earlier.
A unified dashboard also gives retail operations, IT, merchandising, and leadership teams a shared view. Fragmented reports often lead to fragmented decisions. When teams use the same store KPI dashboard, discussions become more specific: which stores, which time periods, which signals, and which operational response.
Implementation guidance: how to make the dashboard useful
Retailers should avoid treating a dashboard rollout as a screen-design project. The important work is deciding which operational decisions the dashboard must support.
Start with the business questions. Before choosing views and metrics, define the decisions that regional teams need to make weekly, daily, and during trading hours. These may include staff planning, campaign evaluation, store comparison, customer flow review, device monitoring, and network resilience.
Map metrics to actions. Footfall counting, dwell time analytics, conversion rates, zone analysis, occupancy monitoring, device health, and network status should each connect to a decision. If a metric does not change what someone does, it should not dominate the dashboard.
Create role-specific views. A CTO may need network resilience and retail IoT monitoring. A VP Store Operations may need store performance comparison. A regional manager may need exceptions and trends by location. A store manager may need simple, focused signals that support day-to-day action.
Set alert rules carefully. Alerts should support action, not create noise. For example, a device offline alert, a sudden drop in real-time footfall data, or an unusual occupancy pattern may deserve attention. Thresholds should be tuned to store format, trading hours, and local context.
Govern the data before automating action. Gartner's 2026 AI-driven store execution abstract highlights the need for workflow orchestration, data validation, and guardrails. This is important for any retailer considering AI-enabled operations. A unified dashboard should first help teams trust the data, understand the context, and define the limits of automated recommendations.
Roll out by store clusters. For regional retailers, it may be more practical to start with a subset of stores: Singapore stores, a flagship cluster, a format group, or a regional pilot. This helps teams refine metrics, reporting cadence, and escalation workflows before scaling.
Train teams around decisions, not software features. Store teams should understand what each metric means, what action it supports, and when to escalate. This improves adoption because the dashboard becomes part of operational management rather than a separate reporting habit.
How to measure dashboard adoption without inventing commercial results
Retailers should be careful with unsupported financial claims. A unified operations dashboard can support better visibility, faster diagnosis, and more consistent decision-making, but each retailer's financial result depends on store format, baseline operations, execution quality, and market context.
Practical adoption measures may include the percentage of stores reporting complete data, number of active users by role, frequency of dashboard review in operations meetings, time taken to identify stores needing attention, number of device or network issues visible before escalation, consistency of KPI definitions across regions, and use of footfall, conversion, and dwell time data in store reviews.
These measures are operationally useful because they show whether the dashboard is becoming part of management practice. The first objective is reliable visibility. Commercial impact should be assessed after the operating rhythm is established and measured against each retailer's baseline.
Why this matters for AI-enabled retail operations
The retail industry is investing heavily in AI, analytics, and connected store technology. MarketsandMarkets projects the retail analytics market to grow from USD 11.31 billion in 2026 to USD 20.65 billion by 2031. Fortune Business Insights projects the global AI in retail market to grow from USD 16.54 billion in 2026 to USD 105.88 billion by 2034, with Asia Pacific expected to grow from USD 3.37 billion in 2025 to USD 4.62 billion in 2026.
Those numbers show market momentum, but the operational challenge is more specific: retailers need data they can trust, workflows they can govern, and dashboards that support decisions across every store.
This is where a unified retail operations dashboard becomes strategically important. Before AI can recommend, automate, or escalate store actions, the business needs a reliable view of store activity, customer flow, device health, and network readiness.
For Singapore and APAC retailers, the opportunity is to move from fragmented reporting to operational control. Vortex Cloud provides the unified dashboard layer. xTrack contributes the in-store shopper intelligence needed to understand footfall, dwell time, conversion, occupancy, and zone activity. xPilot 3 Pro supports network resilience so connected store systems remain visible and manageable.
The result is not another report. It is one view of every store, designed to help retail leaders act with better context.
Conclusion
Retail leaders do not need more isolated dashboards. They need one operational view that connects store performance, shopper behavior, device status, and network resilience.
For multi-store teams across Singapore, Southeast Asia, and APAC, a unified retail operations dashboard can help close the gap between what happens in stores and what leaders can see. It supports better questions, faster diagnosis, and more consistent regional execution.
xRetail Solutions brings this together through Vortex Cloud, xTrack, and xPilot 3 Pro: unified operations visibility, AI shopper intelligence, and resilient store connectivity across every location.
See how xRetail Solutions connects shopper intelligence, resilient store networks, and unified operations visibility across every store. Explore Vortex Cloud, xTrack, and xPilot 3 Pro, or contact xRetail Solutions to discuss your multi-store operations visibility needs.
Frequently Asked Questions
What is a unified retail operations dashboard?
A unified retail operations dashboard is a single view of store performance and operational signals across multiple locations. It can include footfall, conversion, dwell time, occupancy, zone activity, device health, network status, and store KPI comparison.
Why do APAC retailers need a multi-store analytics dashboard?
APAC retailers often manage different store formats, markets, infrastructure environments, and operating teams. A multi-store analytics dashboard helps leaders compare performance consistently, identify location-level issues, and manage regional operations with better visibility.
How does real-time footfall data improve store operations?
Real-time footfall data helps retailers understand whether store performance is driven by traffic levels, conversion rates, or customer flow patterns. This supports better staffing, merchandising, campaign review, and store comparison.
What role does device health monitoring play in retail analytics?
Device health monitoring helps teams confirm whether connected store systems are online and reporting reliably. This matters because incomplete device data can affect the quality of store performance analysis.
How do Vortex Cloud, xTrack, and xPilot 3 Pro work together?
Vortex Cloud provides the unified real-time dashboard for store operations. xTrack provides AI shopper intelligence, including footfall, dwell time, conversion, occupancy, and zone analysis. xPilot 3 Pro supports 5G multi-WAN failover and retail network resilience.
Sources
- IMDA and EnterpriseSG: Refreshed Industry Digital Plan to Support Retailers
- EnterpriseSG and IMDA: Refreshed Retail Industry Digital Plan factsheet
- NVIDIA: 2026 State of AI in Retail and CPG Survey
- Gartner: Insights for Digital Transformation in Retail
- Gartner: Governing AI-Driven Store Execution
- MarketsandMarkets: Retail Analytics Market Report 2026-2031
- Fortune Business Insights: Artificial Intelligence in Retail Market Report
Related Articles
Continue exploring insights from xRetail Solutions

xRetail at IRSE 2026: Rethinking Retail with Indonesia’s Retail Leaders
August 27, 2026
Store Heatmap Analysis: How Zone-Level Intelligence Improves Retail Layouts in Singapore and APAC
August 25, 2026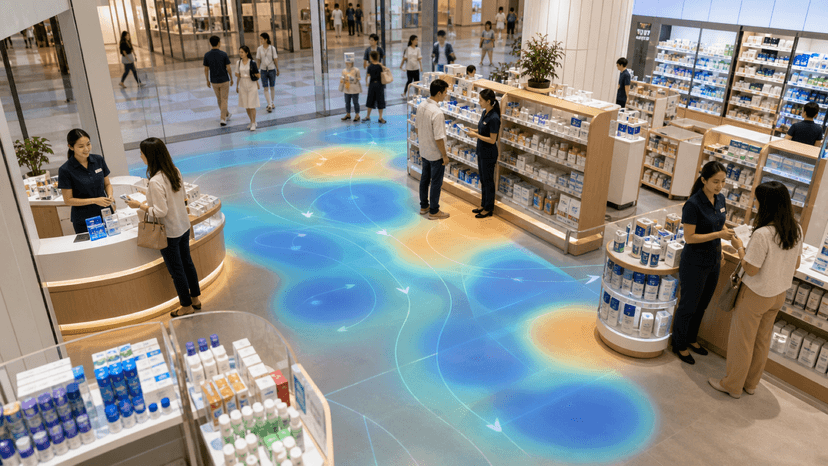
AI Footfall Analytics for Retail Labour Planning in Singapore and APAC
August 20, 2026Ready to Transform Your Retail Operations?
Explore how xRetail Solutions connects shopper intelligence, resilient store networks, and unified operations visibility for modern retail teams.
Contact Our Team