
AI Footfall Analytics for Retail Labour Planning in Singapore and APAC
Retail labour planning has become a more strategic operating discipline for Singapore and APAC retailers. Store teams are expected to protect service quality, manage cost pressure, support campaigns, and respond to uneven demand across weekdays, weekends, holidays, and mall events. At the same time, many retailers still plan staffing with incomplete visibility into what is happening inside the store.
Footfall analytics gives retail leaders a clearer way to understand customer demand before it becomes a sales result. With xTrack, retailers can use footfall counting, people counting, store heatmap analysis, dwell time analytics, conversion rates, occupancy monitoring, shopper journey signals, and zone analysis to understand when customers enter, where they move, which areas attract attention, and where staffing coverage may need to change.
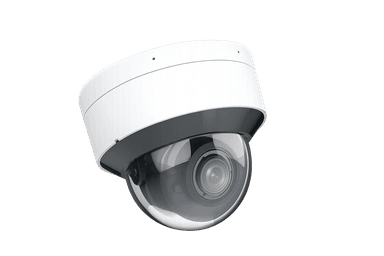
xTrack
Footfall counting, people counting, heatmaps, dwell time, zone analysis, occupancy monitoring, and store conversion signals
Learn More →This does not mean replacing managers or reducing headcount by default. The stronger use case is workforce planning: putting the right staff in the right place at the right time, based on observed customer flow rather than assumptions alone.
Why footfall analytics matters for retail labour planning in 2026
For Singapore retailers, the operating context makes this especially relevant. MOM reported that Singapore's labour market remained tight in 1Q 2026, with unemployment at 2.0 percent overall and 73,300 job vacancies in March 2026. The job-vacancies-to-unemployed-persons ratio was 1.46. In retail, where service quality depends on store-level execution, tight manpower conditions make scheduling accuracy more valuable.
The Retail Progressive Wage Model also makes labour planning a boardroom issue, not just a store manager issue. MOM states that the Retail Progressive Wage Model is mandatory for covered Singapore citizen and permanent resident retail workers employed by firms that hire foreign workers. It includes wage and training requirements, and MOM notes the sector has seasonal sales fluctuations, allowing wage requirements to be averaged over a three-month period.
The implication is practical: when staff hours are planned poorly, retailers may feel the cost on both sides. Too little coverage during real traffic peaks can affect service quality and missed conversion opportunities. Too much coverage during low-demand periods can put pressure on margins. AI camera retail analytics helps close the gap between store traffic reality and staffing plans.
Singapore Retailers Association commentary for Budget 2026 also pointed to manpower shortages, rental and operating costs, ecommerce competition, evolving consumer demands, and difficulty attracting skilled foreign workers despite increased use of technology. The International Trade Administration similarly notes that labour shortages make it difficult to adequately staff Singapore physical stores and ecommerce warehouses, while high rental costs erode profitability.
That combination makes store-level demand visibility more valuable. Retailers do not need generic AI promises. They need a practical way to match staff hours, skill mix, and floor coverage to observed customer traffic patterns by hour, day, campaign period, and zone.
Why sales data alone creates scheduling blind spots
Sales data is essential, but it is not the same as demand data. A store can have strong sales because a small number of visitors made large purchases. Another store can have weak sales despite strong traffic because visitors did not convert. A third location may see high movement in one area and low engagement in another, even when the day's total revenue looks normal.
If retailers schedule only from sales history, they can miss four common blind spots.
First, sales data does not show lost opportunity. If a store was under-covered during a campaign period, the sales result may understate true demand because some visitors left without buying or did not receive timely assistance. Footfall counting helps reveal whether low sales came from low traffic or from weak traffic-to-sales conversion.
Second, sales data does not show hourly customer flow. A day with acceptable revenue can still include intense mid-day or evening peaks. People counting by hour gives operations teams a clearer view of when store coverage should be stronger and when leaner staffing may be enough.
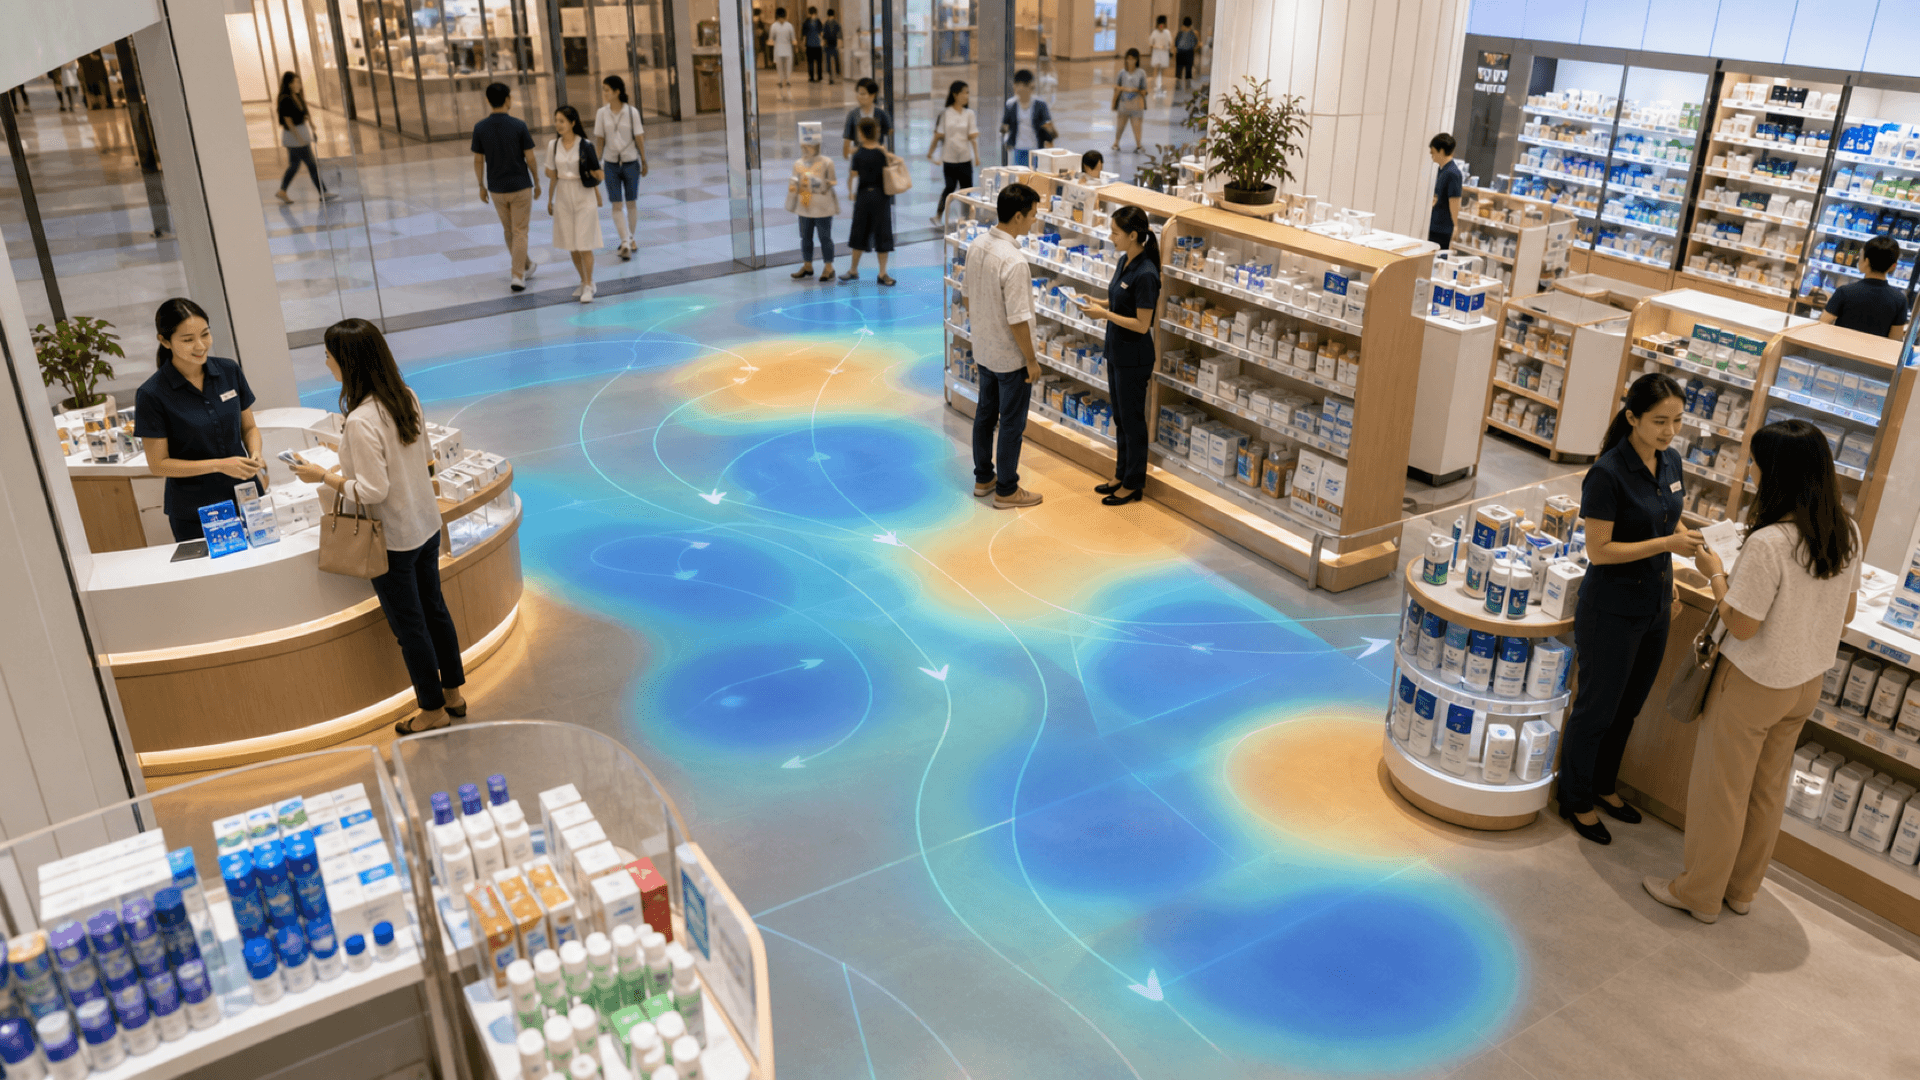
Third, sales data does not show where customers spend time. Store heatmap analysis and shopper heatmap views help teams see which zones attract attention, which areas are passed through quickly, and where associates may need to be positioned during high-demand periods.
Fourth, sales data does not separate traffic quality from transaction outcome. Dwell time analytics can show whether customers are spending meaningful time in key zones. When dwell time rises but conversion does not follow, the issue may be product availability, merchandising, associate coverage, service readiness, or promotion clarity. The answer is not always more staff, but it is often better deployment of staff.
This is where xTrack becomes useful as an operations planning layer. It gives store leaders the traffic and zone intelligence needed to inform workforce management, daily briefs, and store coverage decisions. It does not need to replace existing rostering tools. It can provide the missing demand signal those systems and managers need.
How footfall analytics supports store-level staffing decisions
AI footfall analytics supports labour planning by turning store traffic into patterns that managers can act on. For Singapore and APAC retail teams, the most useful patterns are usually hourly, daily, campaign-based, location-based, and zone-based.
Hourly patterns show when customer traffic rises and falls across the trading day. A fashion retailer may see browsing traffic after office hours. A convenience store may see different peaks around lunch, commute windows, or late evening. A mall tenant may experience traffic shifts tied to mall events, school holidays, or nearby office occupancy. Footfall counting gives managers a clearer view of these patterns by store.
Daily patterns help separate weekday behaviour from weekend behaviour. A store that looks average at monthly level may have very different staffing needs on Friday evenings, Saturdays, and public holidays. For multi-store operators, the differences can be sharper across malls, neighbourhood locations, transit-linked stores, and tourist-heavy areas.
Campaign patterns help retail teams understand whether promotions attract more visitors, change dwell time, or improve store conversion rate. If a campaign increases traffic but conversion remains flat, operations leaders can investigate staff coverage, zone-level engagement, and product availability. If traffic is unchanged but conversion improves, the campaign may be reaching shoppers who are already in-store more effectively.
Location patterns matter because no two stores behave exactly the same. Retail analytics Singapore teams often face this challenge across compact but highly varied retail environments: CBD, heartland malls, airport retail, tourist districts, and mixed-use developments can behave differently even within the same brand. Store analytics APAC becomes even more complex when brands operate across countries with different trading calendars, staffing models, and consumer behaviours.
Zone-level patterns are where staff deployment becomes more precise. Instead of asking whether a store is busy overall, leaders can ask which parts of the store are busy, when, and for how long. This helps teams decide where product specialists, service staff, or managers should focus attention during peak periods.
How zone analysis and dwell time guide in-store deployment
Store labour planning is not only about how many people are rostered. It is also about where they are deployed.
xTrack supports this by connecting footfall, heatmaps, dwell time, conversion, occupancy, and zone views. A store may have enough people on the roster but still have weak coverage in the wrong zone. Another store may have high front-of-store presence but limited support in a product area where customers spend time and need advice.
Zone analysis can help retailers answer practical questions: which product zones attract the most customer movement during peak hours, which zones have long dwell time but weaker conversion, which areas are frequently visited but lightly covered by staff, whether campaign displays change customer movement through the store, whether some locations experience congestion during high-traffic periods, and whether different stores need different staff skill mixes based on customer behaviour.
For example, a consumer electronics store may see strong traffic near demo areas during weekends. If dwell time is high but conversion is weaker than expected, the store may need more specialist support in that zone during specific windows. A pharmacy may see recurring service area demand at certain hours. A fashion retailer may find that fitting-area-adjacent zones need more floor coverage during campaign periods.
The point is not to make broad assumptions from one day of data. The value comes from repeat patterns over time. When footfall analytics, dwell time analytics, and store conversion rate data are reviewed together, retailers can make more confident staffing decisions without relying on anecdote alone.
Vortex Cloud can strengthen this operating rhythm by giving leaders a unified view across stores. A multi-store analytics dashboard helps regional teams compare store performance, identify outliers, and review real-time footfall data alongside store KPIs. This matters when APAC teams need to support many store formats without waiting for fragmented reports.
Measuring staffing impact without fabricated ROI claims
Retail technology content often overpromises. Labour planning should not be measured with unsupported claims about payroll savings or conversion uplift. Without verified customer data, the better approach is to use a disciplined measurement framework.
A practical framework starts with a baseline. Before making changes, retailers should capture current traffic by hour, staff coverage by hour, conversion rate, sales per labour hour, dwell time by key zone, and service-area coverage patterns. The goal is to understand how the store currently operates before changing the model.
Next, identify the mismatch. Look for high-traffic windows with low coverage, low-traffic windows with heavy coverage, zones with strong dwell time but limited associate presence, and stores where conversion trends do not match traffic trends. These are planning hypotheses, not conclusions.
Then test a controlled adjustment. A retailer might shift coverage by one or two hours, move a product specialist to a higher-demand zone during peak windows, adjust floor coverage during campaign periods, or brief staff differently based on expected customer flow. The adjustment should be specific enough to measure.
After the change, compare results against the baseline. Useful measures include traffic-to-sales conversion, sales per labour hour, conversion by time block, dwell time in key zones, zone coverage consistency, and manager feedback. For multi-store retailers, compare similar stores where possible rather than treating every location as identical.
Finally, document the decision logic. The purpose of AI footfall analytics is not simply to produce dashboards. The purpose is to build a repeatable operating cadence: observe traffic, identify coverage mismatches, test adjustments, measure outcomes, and refine the next schedule or deployment plan.
This approach keeps claims conservative and useful. xTrack can provide the shopper intelligence needed to inform better staffing decisions. The business outcome depends on how retailers apply the insight across store operations, training, merchandising, and workforce management.
Implementation checklist for Singapore and APAC retailers
Start with the decision, not the dashboard. Are you trying to improve weekday coverage, campaign staffing, zone deployment, store comparison, specialist allocation, or peak-hour planning? Clear decisions make the analytics more actionable.
Review customer traffic by hour, day, and campaign period. Compare footfall counting and people counting data with staff rosters, sales, and conversion trends. The goal is to identify where traffic demand and staff coverage are misaligned.
Use store heatmap analysis to inform staff positioning, product specialist coverage, and daily floor plans. Heatmaps can show which zones attract attention and where customers move, which helps managers allocate floor coverage with more precision.
Review dwell time with conversion. Long dwell time is not automatically positive or negative. It becomes meaningful when reviewed with conversion, product category, service context, and staff coverage. Dwell time analytics helps managers ask better questions about customer intent and associate support.
Compare stores carefully. For APAC retailers, store comparison should account for format, location, trading calendar, and customer profile. A mall store, tourist store, and neighbourhood store may need different labour patterns even under the same brand.
Connect insights to existing workforce tools. If the retailer already uses workforce management or rostering software, xTrack can provide traffic and zone intelligence that informs those planning decisions. The analytics layer should support the operating workflow rather than sit outside it.
Build a weekly review cadence. Use a short weekly review to compare traffic, conversion, dwell time, and staffing assumptions. Over time, this creates a stronger feedback loop between store teams and regional operations.
Keep staff communication constructive. Position the data as a way to improve service coverage and reduce guesswork, not as a surveillance or headcount-cutting tool. The strongest programmes use analytics to support managers and frontline teams.
Conclusion
Singapore and APAC retailers are under pressure to operate with more precision. Labour is hard to hire, wages and training requirements need careful planning, rent remains material, and customer demand is uneven. In that environment, staffing decisions need better demand signals than sales history alone.
AI footfall analytics helps retailers see what sales data cannot: how many people entered, when traffic peaked, where shoppers moved, how long they stayed, and whether traffic converted. With xTrack, store teams can use footfall counting, people counting, heatmaps, dwell time, conversion rates, occupancy monitoring, shopper journey signals, and zone analysis to plan labour around real customer behaviour.
The right goal is not automation for its own sake. The right goal is better retail operations: clearer coverage, stronger service readiness, smarter deployment, and a more disciplined way to measure staffing decisions across stores.
See how xTrack helps retail teams connect footfall, dwell time, heatmaps, occupancy, shopper journey, and conversion data with better store operations planning.
Frequently Asked Questions
What is footfall analytics in retail?
Footfall analytics measures and analyses customer traffic data in physical stores. It can include footfall counting, people counting, traffic patterns, dwell time, heatmaps, conversion rates, occupancy monitoring, and zone-level movement.
How can footfall analytics improve retail labour planning?
Footfall analytics helps retailers compare staff coverage with actual customer traffic by hour, day, campaign period, and zone. This can inform scheduling, floor deployment, service-area coverage, and store manager planning.
Does xTrack create staff rosters automatically?
No. xTrack provides footfall, heatmap, dwell time, conversion, occupancy, shopper journey, and zone intelligence that can inform workforce management or rostering decisions. It should be positioned as an operations planning layer, not standalone rostering software.
Why is sales data not enough for staff planning?
Sales data shows what was purchased, but it does not show all customer visits, lost opportunity, traffic peaks, movement patterns, or dwell time. Footfall analytics helps retailers understand whether low sales came from low traffic, weak conversion, or store-level execution gaps.
How should retailers measure the impact of staffing changes?
Retailers should start with a baseline, identify traffic and coverage mismatches, test specific staffing adjustments, and compare metrics such as conversion rate, sales per labour hour, dwell time, and zone coverage consistency. Fixed savings or uplift claims should be avoided without verified data.
Sources
- Singapore Ministry of Manpower: Labour Market Report 1Q 2026
- Singapore Ministry of Manpower: Progressive Wage Model for the retail sector
- Singapore Retailers Association: Budget Recommendations 2026
- International Trade Administration: Singapore Retail Sector
- The Business Times: EnterpriseSG and IMDA launch refreshed Retail Industry Digital Plan
- IMDA: Retail Industry Digital Plan
- Cushman and Wakefield: Singapore Retail MarketBeat Q2 2026
- Aon: APAC AI adoption and workforce readiness study
Related Articles
Continue exploring insights from xRetail Solutions

xRetail at IRSE 2026: Rethinking Retail with Indonesia’s Retail Leaders
August 27, 2026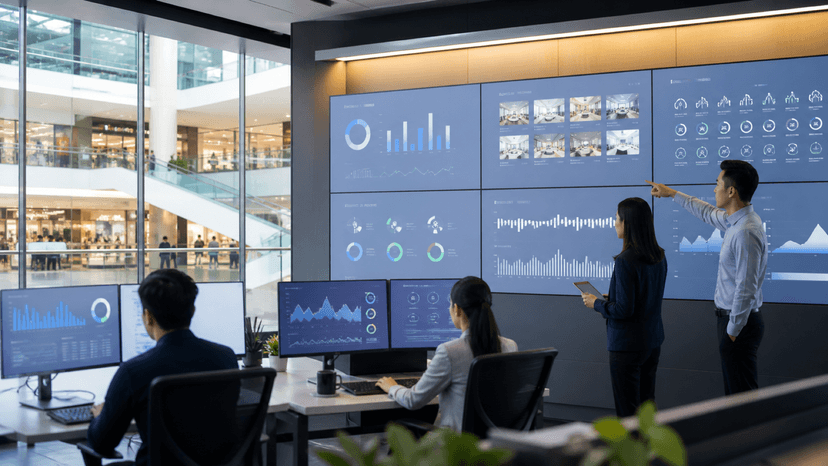
One View of Every Store: How Unified Operations Dashboards Give APAC Retail Leaders Real-Time Control
August 27, 2026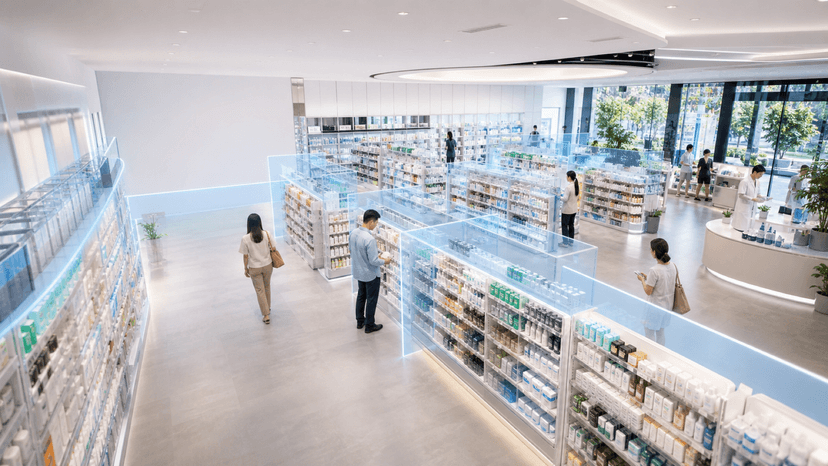
Store Heatmap Analysis: How Zone-Level Intelligence Improves Retail Layouts in Singapore and APAC
August 25, 2026Ready to Transform Your Retail Operations?
Explore how xRetail Solutions connects shopper intelligence, resilient store networks, and unified operations visibility for modern retail teams.
Contact Our Team