
Store Heatmap Analysis: How Zone-Level Intelligence Improves Retail Layouts in Singapore and APAC
Store heatmap analysis gives retail teams a clearer way to understand how shoppers actually move through a physical store. For Singapore and APAC retailers, this matters because every square metre is under pressure to perform. Rent, labour, inventory, fixtures, and promotions all compete for space, but many store teams still make layout decisions based on sales reports, manager observation, and periodic walk-throughs.
Sales data shows what was bought. It does not show how many shoppers entered, which zones they reached, where they slowed down, which displays were missed, or whether a category failed because of poor demand or poor visibility.
xTrack
Footfall analytics, heatmaps, dwell time, zone analysis, occupancy monitoring, shopper journey, and store conversion signals
Learn More →That gap is becoming harder to ignore. Singapore continues to push retail digitalisation through the refreshed Retail Industry Digital Plan, launched by Enterprise Singapore and IMDA on 26 May 2026. Business Times also reported IMDA's 2025 finding that nine in 10 retail SMEs saw productivity gains from digital adoption. At the same time, SingStat's latest services data showed June 2026 retail trade sales rising 4.0 percent year-on-year while F&B services sales fell 2.3 percent year-on-year. The takeaway for operators is simple: headline revenue does not explain enough. Physical retailers need sharper visibility into traffic, engagement, and conversion.
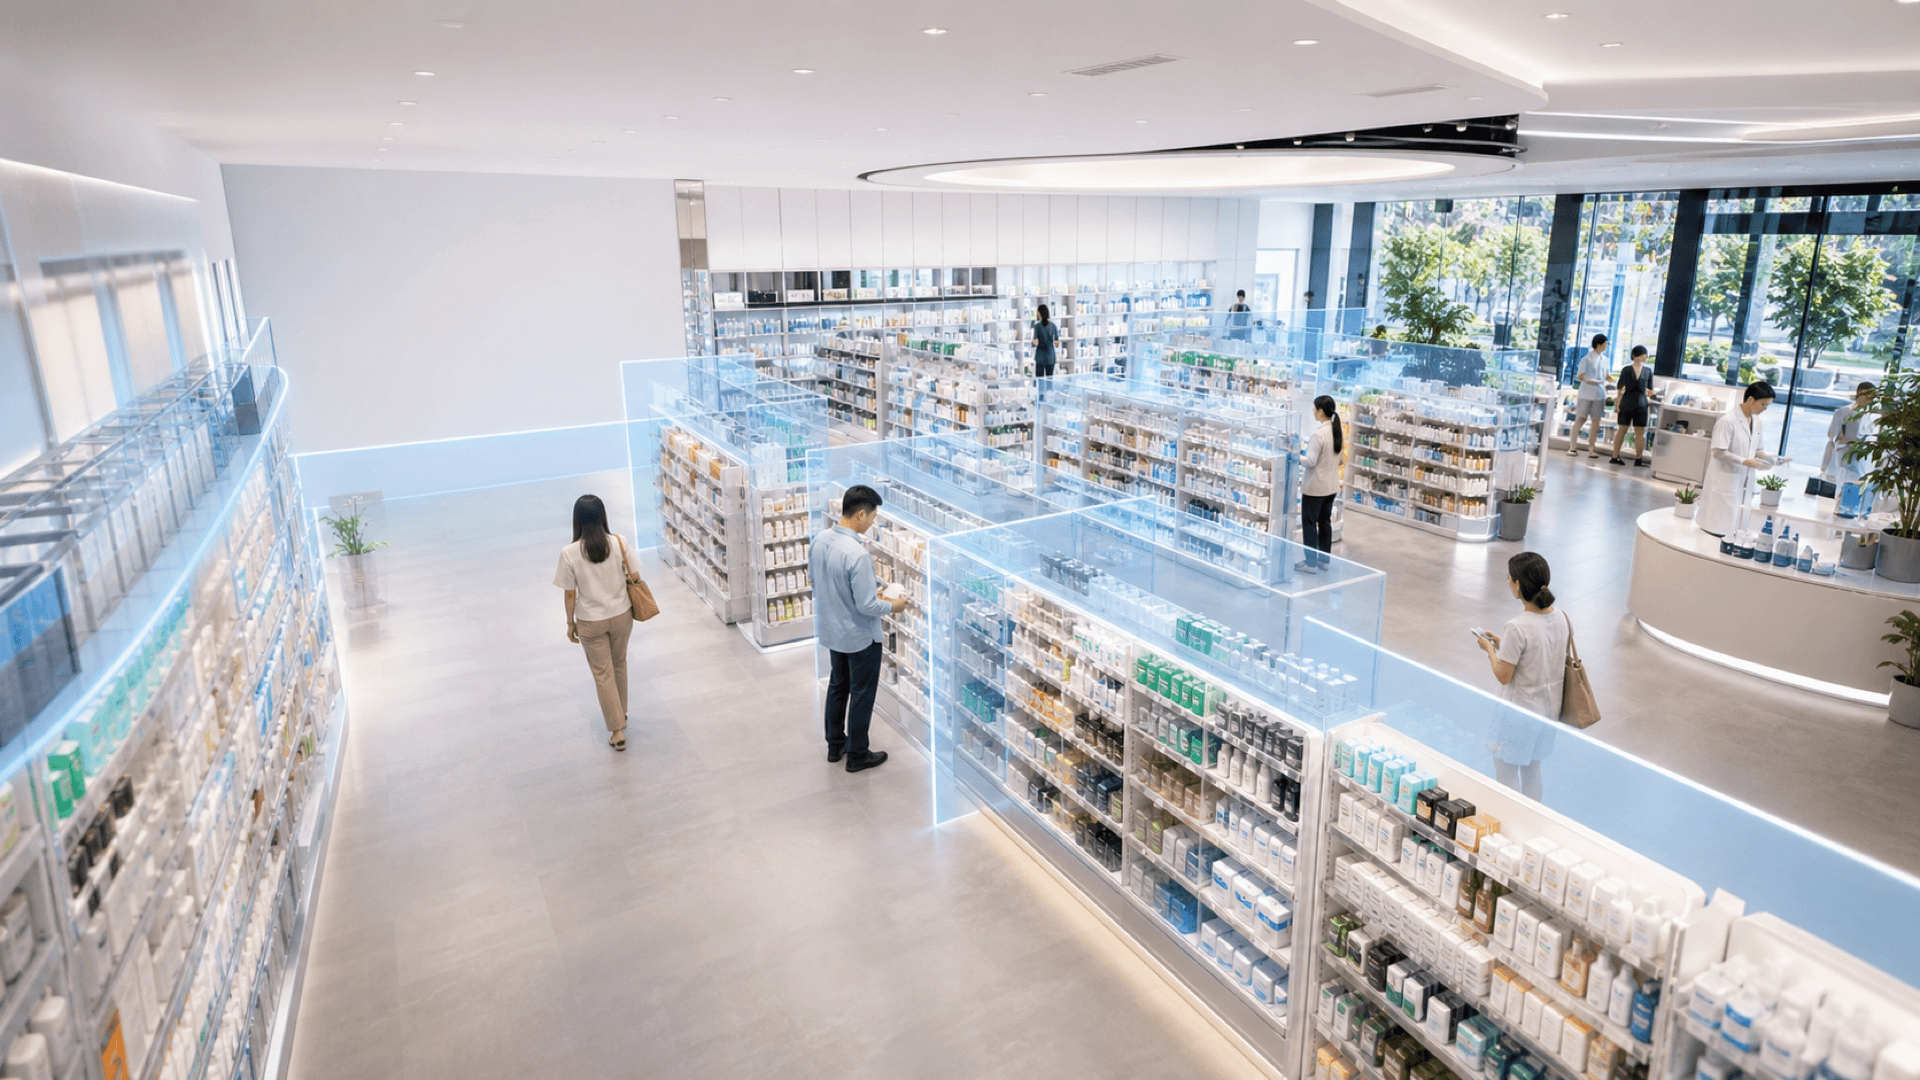
Zone-level intelligence helps close that gap. By combining footfall counting, people counting, shopper heatmaps, dwell time analytics, zone analysis, occupancy monitoring, and store conversion signals, retailers can test layouts with the same discipline ecommerce teams bring to digital journeys.
What zone-level intelligence measures
Zone-level intelligence breaks a store into meaningful areas and measures how shoppers move through each one. These zones could include entrances, promotional tables, gondola ends, seasonal areas, category aisles, fitting areas, service counters, product demo spaces, or high-value fixtures.
The goal is not to create more reports. The goal is to answer operational questions that sales data alone cannot answer: which areas attract the most traffic, which areas are visible but not engaging, which areas receive little traffic despite holding important products, which displays create dwell but do not support conversion, which shopper paths suggest congestion or missed categories, and which layout changes improve movement and engagement after launch.
For xRetail, this is where xTrack fits as an AI shopper intelligence layer. xTrack is positioned around footfall analytics, heatmaps, dwell time, demographics, shopper journey tracking, occupancy, and store conversion rate signals. Vortex Cloud then gives multi-location teams a unified operations dashboard to compare store performance across Singapore, Southeast Asia, and wider APAC markets.
Store heatmap analysis for hot zones, cold zones, and shopper flow
Store heatmap analysis helps teams see where shoppers concentrate, where they pass through, and where they rarely go. In a busy store, this is more reliable than relying only on staff observation, because the same floor can behave differently by daypart, weekday, campaign period, weather, mall traffic, or nearby events.
Hot zones are areas with consistently high movement or presence. They may be near entrances, popular categories, promotional displays, or natural paths through the store. These zones are valuable, but high traffic alone does not mean they are being used well. A hot zone may attract attention without creating enough engagement or conversion.
Cold zones are areas with low shopper presence. A cold zone may signal dead space, poor sightlines, weak category placement, confusing navigation, or a product section that needs stronger merchandising support. In supermarkets, this might appear as a bypassed aisle segment. In fashion retail, it might be a rear display wall that looks good in planogram review but receives limited shopper attention. In electronics, it might be a demo area that is too far from the natural browsing path.
Transition paths show how shoppers move between zones. These paths matter because shoppers rarely experience the store the way the floorplan was drawn. A fixture may block discovery. A promotional table may pull shoppers away from a priority category. A service area may affect movement through nearby shelves. Heatmap data turns these observations into patterns that teams can compare over time.
Why dwell time analytics adds a second layer of truth
Traffic volume tells you where shoppers go. Dwell time analytics helps explain where shoppers engage.
This distinction is important. A zone can be high-traffic but low-engagement, which may mean shoppers pass through without stopping. That could be acceptable for a corridor or transition area, but it may be a problem if the zone contains a promotional fixture or high-margin category.
A zone can also be low-traffic but high-engagement. This may indicate a hidden opportunity. The shoppers who discover the area spend time there, but too few people reach it. In that case, the problem may not be product relevance. It may be visibility, signage, fixture placement, or the path shoppers take after entering.
For merchandising teams, dwell time helps separate attention from movement. It can support better decisions about whether a promotional display is being noticed, whether shoppers pause at a new product range, whether a category is being browsed or bypassed, whether fixture placement encourages exploration, and whether a store redesign changes engagement in the intended areas.
Dwell time should not be treated as a success metric on its own. Longer dwell can mean interest, comparison, uncertainty, congestion, or friction. The useful insight comes from reading dwell together with footfall, movement paths, conversion rate, occupancy, staff observations, and POS data.
Practical use cases for layout and merchandising decisions
The strongest use of zone-level analytics is not a one-off dashboard review. It is a repeatable operating habit.
Retailers can use heatmaps and dwell analytics to evaluate entrance zones. If shoppers enter but turn away from a key campaign display, the display may be placed too early, too far from the natural sightline, or too dense to scan quickly. Moving the display slightly deeper into the store may improve visibility and engagement.
Category teams can use zone analysis to compare product areas. A supermarket may find that a category with healthy sales has low traffic but high conversion among shoppers who reach it. That could justify better directional signage, more visible shelf placement, or a cross-merchandising test. A fashion store may find strong traffic around a front table but weak dwell at a nearby rack, suggesting that the table attracts attention but does not guide shoppers into the full collection.
Mall and multi-store operators can compare store layouts across locations. If two stores carry similar assortments but show different shopper paths, the difference may come from entrance orientation, fixture density, mall corridor traffic, or local shopping missions. A multi-store analytics dashboard makes these comparisons easier for regional teams.
F&B retail formats can use occupancy and movement patterns to understand service area flow, customer circulation, and space utilisation without relying only on sales by hour. Convenience chains and pharmacies can identify whether essential categories pull shoppers through the intended route or whether shoppers repeatedly miss certain sections.
The value is practical: better placement, clearer paths, stronger category visibility, and more disciplined testing.
A layout testing workflow retail teams can use
Physical stores should test layout changes with the same mindset ecommerce teams use for digital experiments. The method does not need to be complicated.
Step 1: Define the business question. Start with a specific question. For example: Are shoppers missing the seasonal display? Does the new fixture improve engagement? Is the back category underperforming because of low demand or low traffic? Are shoppers reaching the intended product discovery area?
Step 2: Set baseline metrics. Before changing the layout, capture baseline footfall, zone traffic, dwell time, shopper paths, occupancy, and store conversion rate. Where possible, compare similar days, campaign periods, and trading hours.
Step 3: Make one clear change. Change the fixture, category placement, signage, product grouping, or path design. Avoid changing too many variables at once. If the team changes layout, promotion, staff deployment, and pricing together, it becomes harder to isolate what worked.
Step 4: Measure post-change behaviour. Compare post-change movement, dwell, and conversion signals against the baseline. Look for both intended and unintended effects. A new display may increase dwell in one area while pulling traffic away from another.
Step 5: Combine analytics with store context. Bring together xTrack data, POS performance, staff feedback, campaign notes, and store manager observations. Analytics should make decisions sharper, not remove operational judgment.
Step 6: Scale what works. If a change improves movement and engagement in one location, test it in comparable stores before rolling it out broadly. APAC retail teams often manage stores across very different mall types, street locations, demographics, and shopping missions. A layout that works in one Singapore mall may need adjustment for Indonesia, Vietnam, the Philippines, or suburban formats.
Singapore and APAC governance considerations
Retail analytics in Singapore and APAC should be designed with governance in mind from the start. For shopper intelligence, the safest editorial position is to focus on aggregated and anonymised insights, data minimisation, appropriate access controls, and clear internal policies for how store analytics are used.
Retail teams should also be careful about how they communicate AI in-store. The business goal is not to make shoppers feel watched. The goal is to understand aggregate movement patterns so stores can improve layout, service areas, merchandising, and customer flow.
For regional operators, governance also needs to account for market differences. Privacy expectations, data protection obligations, mall requirements, and internal compliance policies may vary across APAC. Any public claims about PDPA or market-specific compliance should be reviewed against current official guidance before publication.
How xTrack and Vortex Cloud support store optimization
xTrack helps retail teams measure the physical shopper journey through footfall counting, people counting, heatmaps, dwell time, zone analysis, demographics, occupancy monitoring, and store conversion rate signals. These inputs help operators move beyond general store analytics and into specific questions about layout, fixtures, visibility, and shopper engagement.
Vortex Cloud supports the next layer: visibility across locations. Instead of reviewing each store in isolation, regional teams can compare traffic, engagement, device health, and store performance signals through a unified retail operations dashboard.
Together, xTrack and Vortex Cloud help store teams ask better questions: are shoppers entering but not reaching priority zones, which fixtures attract attention across multiple locations, which stores have similar footfall but different conversion patterns, where dwell suggests real engagement, and which layout tests should be repeated, revised, or stopped.
For Singapore and APAC retailers, the opportunity is not just to add AI to the store. It is to make physical retail more measurable, more testable, and more responsive to how shoppers actually behave.
See how xTrack helps retail teams measure footfall, heatmaps, dwell time, zone engagement, shopper journeys, occupancy, and store conversion signals across Singapore and APAC locations.
Frequently Asked Questions
What is store heatmap analysis in retail?
Store heatmap analysis shows where shoppers spend time, move, and concentrate inside a physical store. It helps retail teams identify hot zones, cold zones, transition paths, underused areas, and spaces that may need better merchandising or layout support.
How is dwell time analytics different from footfall counting?
Footfall counting measures how many people enter or pass through an area. Dwell time analytics measures how long shoppers remain in a zone. Together, they help distinguish traffic volume from shopper engagement.
How can heatmaps improve store layout decisions?
Heatmaps can show whether shoppers notice a display, bypass a category, gather in a service area, or fail to reach important zones. Retail teams can use this evidence to test fixture placement, signage, product grouping, and shopper paths.
Can zone-level analytics improve store conversion rate?
Zone-level analytics can help teams diagnose traffic, engagement, and movement patterns that may affect conversion. Any specific conversion improvement should be verified through controlled measurement and cannot be assumed without store data.
How should Singapore retailers approach privacy for in-store analytics?
Keep the focus on aggregated and anonymised shopper intelligence, data minimisation, access controls, and governance. Any public compliance claims should be checked against current official Singapore guidance before publication.
Sources
- IMDA: Retail Industry Digital Plan
- The Business Times: EnterpriseSG and IMDA launch refreshed Retail Industry Digital Plan
- Singapore Department of Statistics: Latest Services Data
- Enterprise Singapore: Retail Industry
- Mordor Intelligence: In-Store Analytics Market
- Research and Markets: AI-Driven Retail Heat Map Market Report 2026
- MDPI Electronics: Computer-Vision Customer Behaviour Tracking and Heatmap Research
Related Articles
Continue exploring insights from xRetail Solutions

xRetail at IRSE 2026: Rethinking Retail with Indonesia’s Retail Leaders
August 27, 2026
One View of Every Store: How Unified Operations Dashboards Give APAC Retail Leaders Real-Time Control
August 27, 2026
AI Footfall Analytics for Retail Labour Planning in Singapore and APAC
August 20, 2026Ready to Transform Your Retail Operations?
Explore how xRetail Solutions connects shopper intelligence, resilient store networks, and unified operations visibility for modern retail teams.
Contact Our Team