
AI-Powered Store Analytics: Bridging Online and In-Store Retail Insights
Online retail has trained teams to expect visibility. Ecommerce managers can see traffic sources, conversion funnels, campaign performance, basket behaviour, abandoned carts, returning visitors, and customer segments. They can compare channels, test experiences, and identify where demand is building or dropping.
The physical store often still operates with less precision. Store teams usually have POS reports, staff feedback, manual observation, customer feedback, stock movement, and periodic audits. These inputs are useful, but they rarely explain the full customer journey inside the store. A store may show strong sales without revealing missed opportunities. Another may show weak sales without making it clear whether the issue is low traffic, poor conversion, ineffective layout, staff coverage, product placement, traffic congestion, or a mismatch between online demand and in-store execution.
That is the gap AI-powered store analytics is built to close.
For retailers in Singapore and APAC, the store is no longer just a transaction point. It is part of a connected commerce journey where customers discover products online, compare options on mobile, visit stores for confidence, receive assisted service, purchase through different channels, and expect consistent fulfilment and support. If digital teams can measure online behaviour in near real time, store operations teams need a comparable layer of intelligence for physical environments.
AI-powered store analytics brings that layer into view. Footfall analytics shows how many people enter and when. Heatmaps show where shoppers move, pause, and engage. Dwell analytics highlights areas of interest. Conversion comparison connects store visits with sales outcomes. AI shopper intelligence can help teams understand broad patterns across traffic, demographics, zones, and store performance without relying only on delayed reports.
The result is not simply more data. The real value is a clearer operating view of how stores perform as part of a unified retail journey.
The Measurement Gap Between Ecommerce and Physical Stores
Most retail leaders already understand the language of digital analytics. They know how to review sessions, traffic sources, funnel drop-off, conversion rates, campaign attribution, repeat purchase, and customer segments. Those metrics shape merchandising, marketing, pricing, and customer experience decisions.
In-store decisions are often less connected. A store manager may know the daily sales result but not how much demand entered the store. A category leader may know a display underperformed but not whether shoppers ignored it, could not reach it, or spent time there without converting. An operations director may see a regional performance gap but not whether it is caused by traffic volume, staffing patterns, store congestion, layout design, or local shopper behaviour.
This creates a common retail blind spot: the business can measure the transaction, but not always the journey that led to it or the journey that failed to convert.
Without store-level behavioural data, physical retail decisions can become too dependent on assumptions. Teams may change layouts based on anecdotal feedback. They may add staff based on peak sales rather than peak traffic. They may judge campaigns by POS uplift alone, even when the real issue is that the campaign drove visits but did not convert in-store. They may compare stores by revenue without accounting for visitor volume, shopper flow, dwell time, or conversion efficiency.
AI-powered store analytics helps move the conversation from "what did the store sell?" to "how did shoppers behave, where did opportunities appear, and what changed the outcome?"
Why Store Analytics Matters Now in Singapore and APAC
The timing matters because AI adoption is moving quickly across the region. Microsoft's AI Economy Institute reported that global generative AI adoption continued rising in the second half of 2025, with Singapore ranked second globally for AI diffusion and 60.9 percent of its working-age population using AI. BCG reported in October 2025 that 78 percent of APAC respondents use AI at least weekly, above the global figure of 72 percent, and that 70 percent of APAC frontline employees use GenAI regularly compared with 51 percent globally.
For retail leaders, this signals a shift. AI is no longer only a head-office strategy discussion. Employees, customers, and competitors are becoming more familiar with AI-assisted workflows. The practical question is not whether AI will influence retail operations. It is whether the data feeding AI systems is complete enough to support better decisions.
Retail-specific signals point in the same direction. Adyen's 2025 APAC retail commentary reported planned AI investment among regional retailers ranging from 47 percent in Japan to 72 percent in Malaysia, with use cases across sales, marketing, fraud prevention, and product innovation. KPMG's 2025 Intelligent Retail report found retailers combining GenAI with predictive analytics and automation, with reported adoption of GenAI at 64 percent, predictive analytics at 58 percent, and robotic process automation at 51 percent among surveyed retailers.
These trends support a practical conclusion: the next stage of retail AI is not only about adopting more tools. It is about improving the operational data layer so AI can help teams act on what is happening across channels, including inside physical stores.
In Singapore and APAC, where retail environments can include malls, transport-linked stores, convenience formats, beauty, fashion, electronics, food service, and multi-format chains, store behaviour can vary sharply by location and time of day. A dashboard that treats every store as a sales endpoint misses the operational reality. Teams need to understand how traffic, engagement, service, and conversion differ across each environment.
The Store Data Layer: From Footfall to Shopper Intelligence
AI-powered store analytics starts with reliable store data. The most useful layer usually combines several signals.
Footfall analytics measures visitor volume. It helps teams understand how many shoppers enter a store, how traffic changes by hour or day, and whether marketing, location, seasonality, or events are influencing visits. Footfall matters because sales alone can hide the difference between low traffic and low conversion.
Heatmaps show how shoppers move through a store. They can highlight hot zones, cold zones, common paths, bottlenecks, and areas that attract attention. For retail operations, this supports better layout decisions, fixture placement, service area planning, and category visibility.
Dwell analytics helps identify where shoppers spend time. Longer dwell can suggest interest, consideration, confusion, congestion, or service needs, depending on the context. When combined with conversion data, dwell time can help teams distinguish between engaged browsing and stalled journeys.
Conversion comparison connects visits to sales. A store with high traffic and low conversion needs a different response from a store with low traffic and high conversion. The first may require service, merchandising, pricing, or stock investigation. The second may require traffic generation or local marketing support.
AI shopper intelligence can combine these signals into patterns that are easier for teams to use. Instead of asking managers to interpret disconnected reports, AI can help surface anomalies, compare similar stores, identify recurring patterns, and support decisions about staffing, layouts, merchandising, and campaign follow-up.
For xRetail, xTrack sits in this store intelligence layer. It is positioned around footfall analytics, heatmapping, demographics, conversion, and AI shopper intelligence. Used with a unified dashboard such as Vortex Cloud, these signals can help retail teams compare stores, identify operational patterns, and make decisions with clearer context.
How AI Turns Store Data Into Operational Decisions
The value of AI-powered store analytics is strongest when it supports specific retail workflows.
Store layout improvement. If heatmaps show that shoppers consistently avoid a section, teams can investigate sightlines, product placement, category adjacency, signage, and fixture design. If a promotional zone attracts traffic but does not support conversion, the issue may not be awareness. It may be assortment, price, stock availability, or staff support.
Staffing alignment. Store managers often schedule around historical sales, but traffic and service demand do not always follow the same pattern. Footfall and dwell data can show when shoppers are entering, browsing, or needing help. This can support better staff allocation by daypart, zone, and expected demand.
Service area monitoring. Heatmaps and traffic patterns can reveal congestion around counters, fitting rooms, service desks, collection points, or high-demand categories. For stores that support omnichannel fulfilment, the same space may need to serve walk-in shoppers, click-and-collect customers, returns, and assisted selling. Visibility into movement and dwell patterns helps teams manage that complexity.
Campaign measurement. Online teams often know whether an ad, email, or app campaign drove traffic. Store teams need to know whether that demand appeared in physical locations and whether it converted. Footfall and conversion analytics can help connect campaign periods with store behaviour, especially when combined with POS and digital engagement signals.
Multi-store comparison. A regional operations leader may want to know why two similar stores perform differently. Sales data alone may not answer that. Store analytics can compare traffic volume, peak periods, zone engagement, dwell patterns, conversion, and operational exceptions. The goal is not to replace manager judgement, but to give managers better evidence.
Bringing Online and In-Store Signals Together
Unified commerce is the strategic frame for this shift. Manhattan Associates' 2026 Unified Commerce Benchmark evaluated retailers across shopping, checkout, fulfilment, and service capabilities. While the benchmark is North America-focused, the operating challenge is relevant for APAC: customers do not think in channels, but many retail systems still do.
Retailers need a more consistent view of behaviour and execution whether the journey starts online, in-store, or across both. A customer may discover an item through social media, check availability online, visit a store, ask for advice, compare prices on mobile, and complete the purchase later. Another may buy online and visit the store for pickup, exchange, or service. Without connected data, each channel sees only part of the journey.
AI-powered store analytics helps physical stores become part of the same measurement discipline as ecommerce. It gives operations teams store-level signals that can be compared with digital traffic, campaign timing, inventory movement, customer service demand, and sales outcomes.
For example, a retailer may see strong online engagement for a product category, but weak in-store conversion. Store analytics can help determine whether shoppers are visiting the relevant zone, whether they dwell there, whether the zone is hard to find, or whether traffic is concentrated at times when staff coverage is thin.
In another scenario, a store may show rising traffic but flat sales. Footfall and conversion data can help identify whether traffic quality changed, whether congestion increased, whether shoppers spent time in non-converting zones, or whether product availability limited purchase outcomes.
These are generalized operating scenarios, not customer claims. The principle is that online and in-store data become more useful when they are compared together, not reviewed in separate reports.
Practical Implementation Considerations
Retail leaders should approach AI-powered store analytics as an operating capability, not a one-off technology installation.
First, define the business questions. A retailer may want to improve conversion, compare store layouts, measure campaign impact, support staff planning, or understand customer flow. Clear questions help teams decide which signals matter and avoid collecting data that no one uses.
Second, connect store analytics with existing systems where appropriate. Footfall, heatmaps, dwell time, POS data, campaign calendars, stock availability, and workforce planning can all become more useful when viewed together. A unified dashboard such as Vortex Cloud can help teams move from fragmented reports to a clearer operational view.
Third, set governance expectations early. Store analytics should be deployed with attention to privacy, data minimisation, access controls, and clear internal policies. Teams should understand what is being measured, how data is used, and who can act on it. This is especially important when analytics involves camera-based or sensor-based inputs.
Fourth, design for store teams, not only head office. If insights are too complex or too delayed, they will not change behaviour. Store managers need simple comparisons, alerts, trends, and next-step guidance. Regional leaders need portfolio-level visibility. Digital and ecommerce teams need store signals that can be compared with campaign and customer journey data.
Fifth, keep resilience in view. Store analytics depends on reliable connectivity and device management. For retailers that need continuity across outlets, xPilot 3 Pro can support network resilience through 5G failover and remote management. This is relevant because analytics loses value when store systems go offline, reports are delayed, or teams cannot access dashboards when decisions need to be made.
What Retail Leaders Should Prioritise Next
The strongest starting point is usually not a broad AI transformation programme. It is a focused store visibility initiative tied to a measurable operating problem.
Retail leaders can begin by asking several practical questions:
Do we know how many people enter each store, by day and hour?
Can we distinguish low traffic from low conversion?
Do we know which zones attract attention and which are underused?
Can we compare campaign activity with store visits and conversion?
Can store managers see insights quickly enough to act?
Are physical-store signals visible alongside ecommerce and POS data?
If the answer to these questions is unclear, the retailer likely has an in-store analytics gap.
AI-powered store analytics helps bridge that gap by making physical retail more measurable. It does not remove the need for experienced managers, strong merchandising, good service, or disciplined operations. It gives those teams better evidence, faster feedback, and a more complete view of how stores perform within the broader customer journey.
For Singapore and APAC retailers, that matters because customer journeys are becoming more connected while operating environments are becoming more complex. Stores need to support discovery, service, fulfilment, returns, engagement, and conversion. The retailers that understand what happens inside the store can make better decisions across the entire journey.
xTrack is designed for that shift. By combining footfall analytics, heatmapping, demographics, conversion, and AI shopper intelligence, xTrack helps retail operations teams see what is happening in the store with more clarity. When connected through Vortex Cloud, those insights can become part of a broader operations dashboard for comparing performance, spotting patterns, and improving decisions across locations.
The future of retail analytics is not online versus offline. It is one connected view of shopper behaviour, store execution, and operational performance.
Frequently Asked Questions
What is AI-powered store analytics?
AI-powered store analytics uses store-level data such as footfall, heatmaps, dwell time, demographics, and conversion signals to help retail teams understand shopper behaviour and operational performance inside physical stores.
How does footfall analytics help retail operations?
Footfall analytics helps teams measure visitor traffic by location and time period. This makes it easier to distinguish between low traffic and low conversion, plan staffing, assess campaign impact, and compare store performance.
What do retail heatmaps show?
Retail heatmaps show movement and engagement patterns inside a store, including high-traffic zones, underused areas, common paths, dwell points, and possible congestion areas.
How can store analytics support unified commerce?
Store analytics gives physical stores a measurable data layer that can be compared with ecommerce, POS, campaign, inventory, and service data. This helps teams understand customer journeys that move across online and in-store channels.
Is xTrack an AI retail analytics solution?
Yes. xTrack is xRetail's AI shopper intelligence solution for footfall analytics, heatmapping, demographics, and conversion visibility in physical retail environments.
What should retailers consider before implementing store analytics?
Retailers should define the business questions, connect analytics to existing operational systems where useful, set privacy and governance expectations, design insights for store teams, and ensure connectivity is resilient enough to support timely decisions.
Sources
- Microsoft AI Economy Institute — Global AI Adoption in 2025
- BCG — Asia Pacific Leads the World in AI Adoption, 30 Oct 2025
- Adyen — APAC insights from Adyen Index Retail Report 2025
- KPMG — Intelligent Retail Report 2025
- Manhattan Associates — Unified Commerce Benchmark 2026
- IMDA Singapore — AI bridges the gap between retailers and omnichannel shoppers
Related Articles
Continue exploring insights from xRetail Solutions
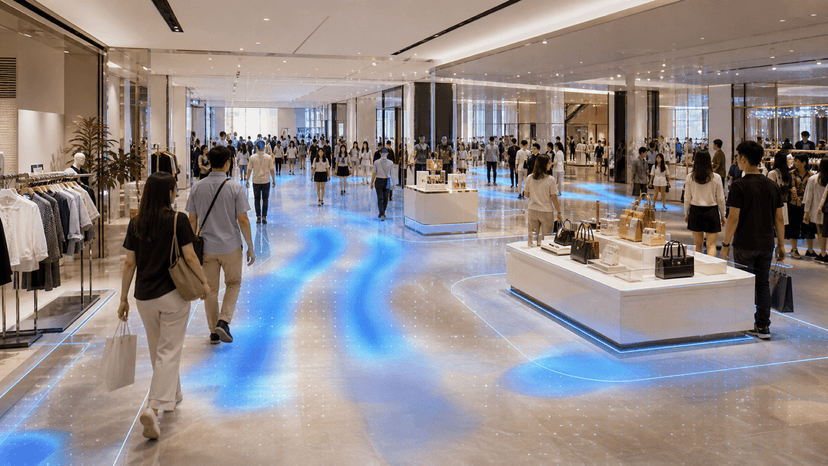
Peak Season Playbook: How Footfall Analytics Prepare APAC Retail Stores for 9.9, 11.11 and Chinese New Year
August 18, 2026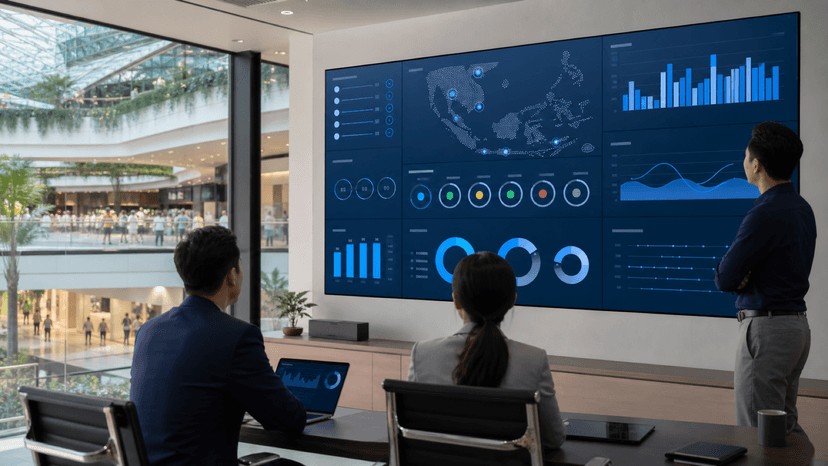
Unified Retail Operations Dashboard: Why Multi-Store Retail Teams Need Real-Time Visibility
August 13, 2026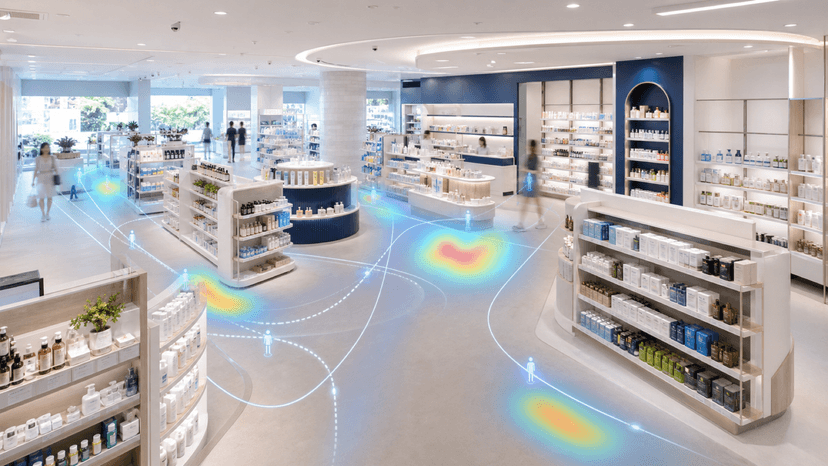
AI Footfall Analytics Retail: How APAC Stores Turn Shopper Movement Into Better Operations
August 11, 2026Ready to Transform Your Retail Operations?
Explore how xRetail Solutions connects shopper intelligence, resilient store networks, and unified operations visibility for modern retail teams.
Contact Our Team