
AI Footfall Analytics Retail: How APAC Stores Turn Shopper Movement Into Better Operations
AI footfall analytics retail leaders can use in 2026 is no longer only a technology trend. For multi-store retailers in Singapore and APAC, it is becoming an operating layer that helps explain what sales reports alone cannot show: how many people entered, where they moved, where they paused, which zones attracted attention, and whether traffic converted into sales.
That matters because retail performance is increasingly uneven across formats, locations, and categories. A headline sales number may tell a leadership team that revenue rose or fell, but it does not explain whether the root cause was traffic, layout, merchandising, staffing, campaign performance, or customer flow. Singapore retail trade sales rose 4.0 percent year on year in June 2026, while food and beverage services sales fell 2.3 percent year on year, according to the Singapore Department of Statistics. Those headline indicators are useful, but store teams need sharper diagnostics at location level.
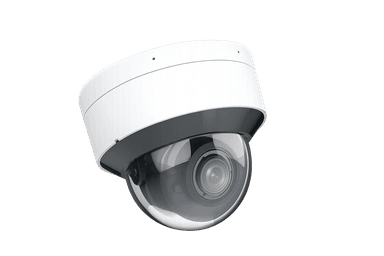
xTrack
Footfall analytics, heatmapping, dwell time, demographics, and AI shopper intelligence for retail stores
Learn More →This is where footfall analytics, store heatmap analysis, dwell time analytics, demographic analytics, and shopper intelligence become practical. They give retail operators a way to connect physical-store behaviour with POS, campaign, staffing, and inventory data. Instead of asking only what sold, teams can ask why it sold, why it did not sell, and what happened before the transaction.
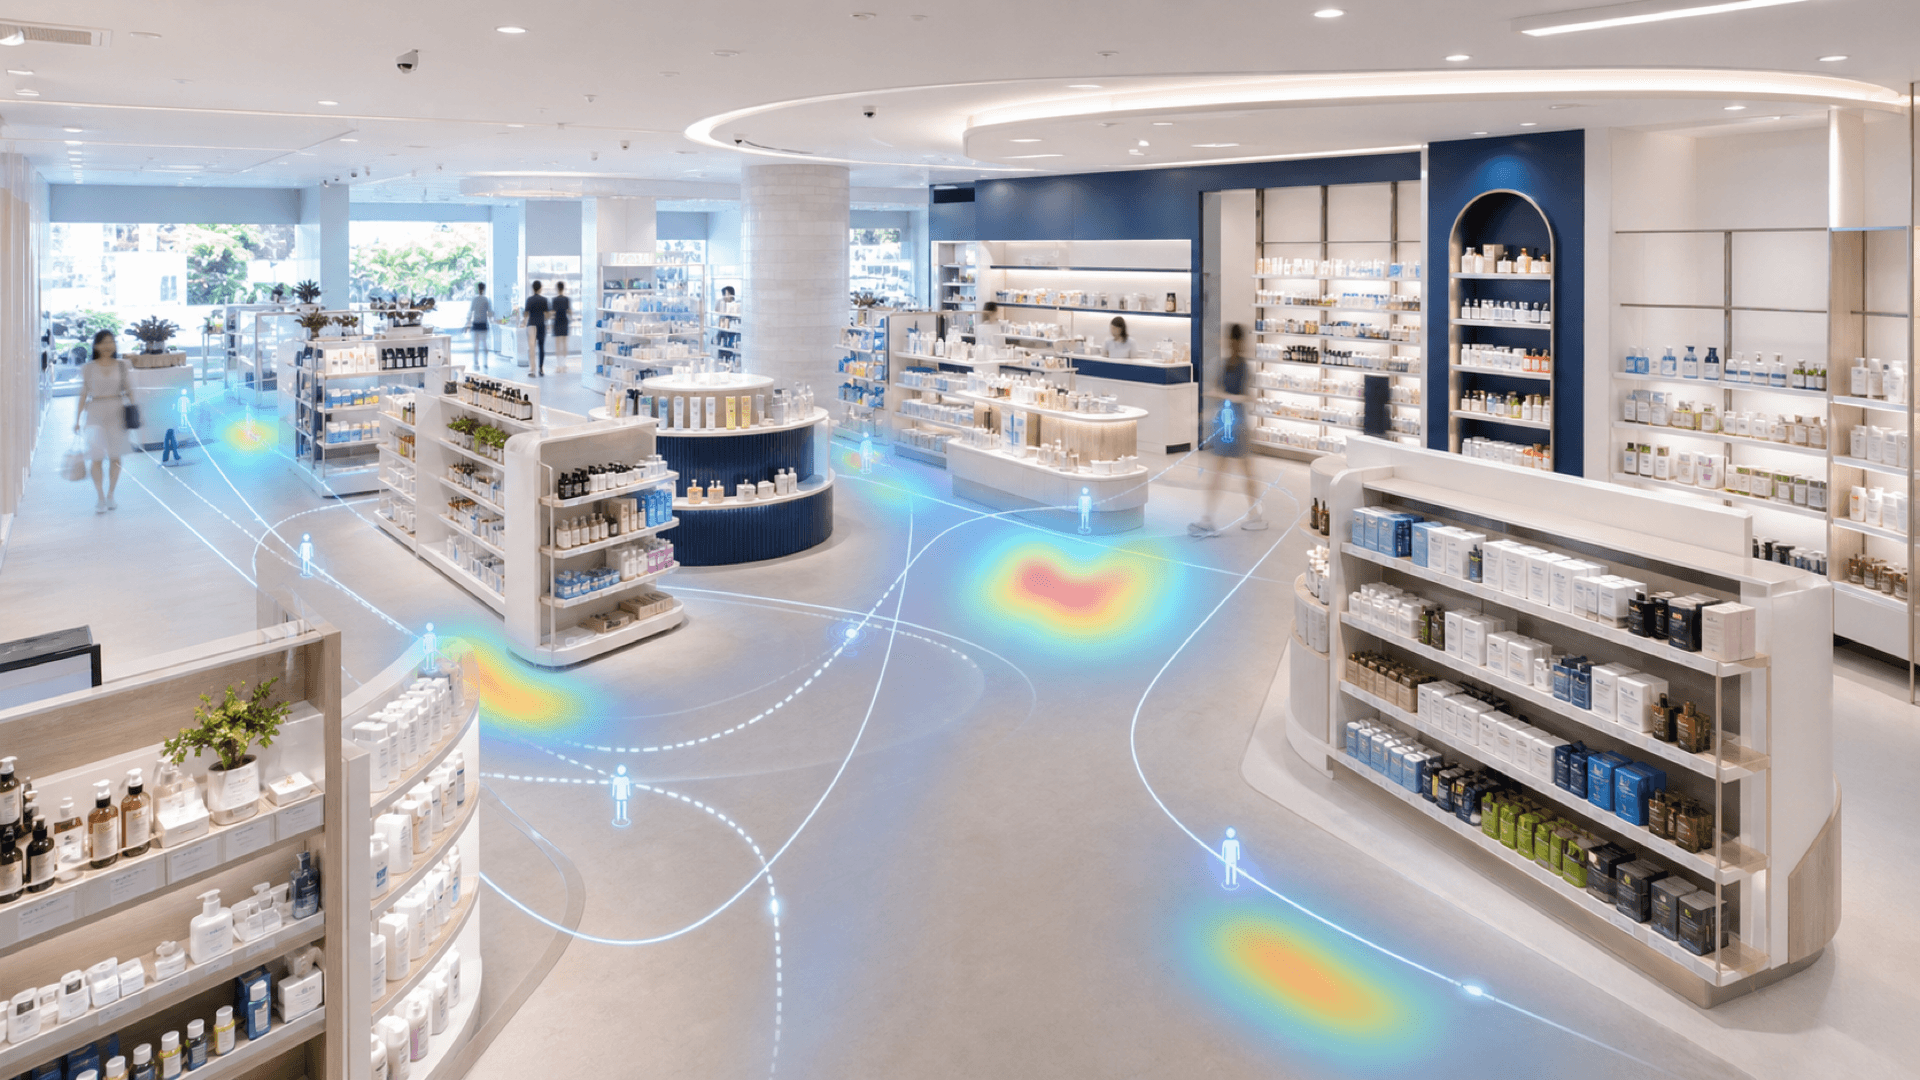
For xRetail, this topic sits directly in the xTrack and Vortex Cloud operating story. xTrack supports aggregated shopper intelligence through footfall, heatmaps, demographics, dwell time, and conversion signals. Vortex Cloud helps bring those signals into a unified operational view across locations, so regional and store teams can compare performance without relying on fragmented reports.
The missing layer between sales data and in-store reality
Most retailers already have sales data. Many have loyalty data, inventory data, campaign calendars, and ecommerce dashboards. The physical store, however, often remains less visible than the digital channel.
An ecommerce team can usually see impressions, clicks, page views, add-to-cart behaviour, checkout completion, and campaign attribution. A store operations team may know daily sales and basket size, but not how many visitors walked in, which zones drew attention, where customers slowed down, or whether staff coverage matched peak periods.
This gap creates several common operating problems. A store with weak sales may be judged as underperforming, even when the real issue is low traffic. Another store may have strong footfall but poor conversion, which points to a different problem: product mix, visual merchandising, service coverage, or store layout.
AI-driven retail traffic analytics helps close this gap by turning in-store movement into structured signals. The goal is not to replace the judgement of experienced retail teams. The goal is to give them better evidence, faster comparisons, and a more consistent way to diagnose stores across the network.
What footfall, heatmaps, dwell time, and shopper intelligence reveal
Retailers do not need every metric at once. The most useful approach is to start with operating questions, then map each question to the right signal.
Footfall counting and retail traffic analytics
Footfall counting gives stores a baseline: how many people entered over a period of time. When combined with sales data, this becomes traffic-to-sales conversion. That is one of the clearest ways to separate a traffic problem from a conversion problem.
For example, two stores may both miss the same sales target. Store A may have low traffic but a healthy conversion rate. Store B may have strong traffic but weak conversion. The operating response should not be the same. Store A may need local marketing, mall event alignment, storefront visibility, or revised trading assumptions. Store B may need better staff coverage, merchandising changes, product availability checks, or service-area review.
For APAC retailers managing mixed estates across malls, high streets, transport hubs, and neighbourhood formats, this distinction is especially important. A Singapore flagship, a suburban mall store, and a compact convenience format may have very different traffic profiles. Retail traffic analytics gives central teams a fairer way to compare performance across store types.
Store heatmap analysis and zone engagement
Store heatmap analysis shows where shoppers move, pause, and engage inside the store. It helps teams understand whether store layouts are working as intended.
In supermarkets and hypermarkets, heatmaps can show aisle-level movement patterns, category engagement, and whether campaign displays are drawing attention. In fashion and specialty retail, they can help compare front-of-store displays, fitting-area proximity, and category zones. In electronics retail, heatmaps can reveal whether shoppers spend time near product demonstration areas or bypass them.
The value is not simply a colourful visual. The value is the operating decision that follows. If a high-margin category is placed in a low-engagement zone, the retailer can test a new placement. If a campaign zone attracts dwell time but does not convert, the offer, assortment, or staff prompt may need review. If shoppers repeatedly avoid a particular path, the store team can inspect fixture density, sightlines, signage, or product adjacency.
Dwell time analytics and customer flow
Dwell time analytics helps retailers distinguish movement from meaningful engagement. A customer passing through an area is different from a customer pausing near a display, product category, service area, or promotional zone.
This is useful across many APAC formats. Pharmacies and beauty retailers can review category discovery and assisted-service area engagement. Cafes and QSR operators can study customer flow around ordering, pickup, dining, and service areas to plan peak staffing windows. Department stores and malls can compare floor-level movement, event effects, and cross-zone flow.
Dwell time should be interpreted carefully. Longer dwell may indicate interest, but it can also point to friction, unclear merchandising, or congestion. The important point is context. When dwell data is combined with sales, staffing, campaign timing, and store observations, it becomes a practical diagnostic signal.
Store conversion rate and traffic-to-sales conversion
Store conversion rate connects visitor counts with transactions. For retail operations leaders, it is often the bridge between shopper intelligence and commercial performance.
A store with rising traffic but flat sales may need conversion support. A store with stable traffic and rising sales may have stronger merchandising, better service coverage, or category mix advantages worth studying. A store with falling traffic but improving conversion may still require top-of-funnel action, but the store team may be doing a good job with the customers who do arrive.
This is also where Vortex Cloud becomes relevant. When real-time footfall data, sales indicators, device health, and store performance comparison appear in one operational dashboard, teams can spot patterns faster. A regional manager can compare stores without waiting for manual reports. A transformation lead can see whether pilot stores behave differently from control stores. A CTO can review whether analytics devices are online and producing usable signals.
Practical APAC use cases by retail format
AI shopper intelligence becomes more useful when it is tied to specific store formats and decisions.
Supermarkets and hypermarkets can use footfall analytics and heatmaps to compare aisle-level engagement, campaign zones, department traffic, and traffic-to-sales conversion. This helps teams see whether promotions are driving movement and whether category placement supports customer flow.
Convenience stores can use compact-format analytics to understand entrance-to-category movement, dwell near promotional areas, and differences across neighbourhood, office, and transport-oriented locations. Small stores often have limited space for testing, so evidence from movement patterns can help teams make sharper layout decisions.
Fashion and specialty retailers can compare front-of-store engagement, fixture placement, fitting-area proximity, and category discovery. If traffic is healthy but conversion is weak, store teams can review product availability, staff coverage, and merchandising presentation.
Pharmacies and beauty retailers can use shopper intelligence to understand category discovery, assisted-service area engagement, and planogram improvement. Movement and dwell signals can help teams see whether customers are finding the right categories and whether advisory areas are placed effectively.
Electronics retailers can assess product demonstration zones, campaign displays, and high-interest areas. If shoppers spend time near a demo area, teams can align staff allocation and product information around that behaviour.
Malls and department stores can review tenant-zone movement, event traffic effects, floor-level heatmapping, and cross-zone shopper flow. These insights can support leasing, activation planning, and operational coordination, while still requiring careful data governance and privacy-aware implementation.
Across all formats, the consistent theme is operational visibility. Store analytics APAC leaders can trust should help teams make better decisions about layout, staffing, merchandising, campaigns, and store comparison.
From isolated analytics to a unified retail operations dashboard
The next stage for many retailers is not simply installing more sensors or dashboards. It is connecting store signals into one usable operating view.
In-store analytics becomes much more valuable when it is combined with the systems retail teams already use: POS, inventory, campaign calendars, staffing plans, and store performance reports. Without that integration, analytics can become another silo. With it, teams can interpret movement, conversion, and sales together.
This is where Vortex Cloud supports the broader xRetail story. A unified retail operations dashboard can help teams compare stores, monitor real-time footfall data, review device health, and understand performance changes across locations. For leaders managing Singapore and regional APAC estates, this kind of single view reduces the lag between observation and action.
For example, a regional team could review stores with high traffic and low conversion, then compare merchandising plans, staffing coverage, and campaign timing. A store operations director could identify locations where peak traffic periods differ from staffing assumptions. A transformation team could measure whether a new layout or campaign is changing zone engagement before making a wider rollout decision.
The point is not to create more reports. The point is to make operating decisions easier to see, discuss, and act on.
How to evaluate AI shopper intelligence responsibly
Retailers evaluating AI footfall analytics should focus on practical fit, data quality, and responsible deployment.
First, define the operating questions. Is the priority traffic visibility, store conversion rate, merchandising effectiveness, staffing alignment, or multi-store comparison? A clear question prevents analytics projects from becoming abstract technology pilots.
Second, check whether the data is aggregated and fit for purpose. xTrack should be described in terms of aggregated footfall, heatmaps, demographics, dwell time, and shopper intelligence. Avoid any claims about identity tracking, facial recognition, or individual-level tracking unless approved product documentation confirms them.
Third, plan for privacy and governance. In Singapore, any discussion of personal data protection should stay high level unless legal review confirms specific wording. Retailers should consider data protection, signage, access control, retention, vendor governance, and internal accountability as part of deployment planning.
Fourth, connect analytics to workflows. Store managers need clear actions, not raw data. Regional teams need consistent comparisons. IT teams need visibility into device health. Executives need a concise view of what changed and where action is needed.
Finally, avoid treating AI as a substitute for retail judgement. The best use of shopper intelligence is to sharpen the questions that operators already ask: why did this store underperform, which zone needs attention, when should staff be deployed, and which layout should be rolled out next?
The 2026 opportunity for Singapore and APAC retailers
The wider market context supports this shift. Singapore's Retail Industry Digital Plan includes in-store analytics as part of growing digital capability, describing technology such as in-store video, IoT sensors, analytics software, and data analysis that generates actionable information about the in-store environment. The same roadmap identifies benefits such as improving in-store experience, uncovering peak shopping times, and understanding customer traffic patterns for more efficient staff scheduling.
Regional momentum is also visible in retail technology events and market forecasts. NRF 2026 Retail's Big Show Asia Pacific took place in Singapore from 2 to 4 June 2026, with reported themes including AI-driven customer experiences, connected retail, robotics, data analytics, and intelligent supply chains. Market research firms also project growth in computer vision AI in retail, AI-driven retail heat maps, in-store analytics, and APAC AI in retail. These third-party market-size and CAGR figures should be read as forecasts from named research firms, not guaranteed outcomes.
For retailers, the practical takeaway is simple: physical stores still matter, but they need better instrumentation. Stores are not just sales endpoints. They are customer experience environments, fulfilment nodes, brand spaces, and service points. If retailers can understand how people move through those spaces, they can make better operational decisions.
AI footfall analytics retail teams can use responsibly gives APAC retailers a clearer view of the store as it actually operates. It helps separate low traffic from low conversion. It shows which zones attract attention. It supports staffing plans around peak periods. It helps merchandising teams test layouts and campaigns. And when connected through Vortex Cloud, it can become part of a unified real-time dashboard for multi-store operations.
For Singapore and APAC retailers under pressure to improve visibility, efficiency, and customer experience, shopper intelligence is not about chasing AI novelty. It is about making the physical store measurable enough to manage with confidence.
FAQ
What is AI footfall analytics in retail?
AI footfall analytics in retail uses sensors, computer vision, and analytics software to measure aggregated store traffic, customer movement, dwell time, demographics, heatmaps, and conversion signals. It helps retailers understand what happens in-store before a transaction occurs.
How does footfall analytics improve store operations?
Footfall analytics helps retailers compare traffic, conversion, peak periods, zone engagement, and store performance. This can support decisions around staffing, merchandising, campaign placement, store layout, and multi-store benchmarking.
What is store heatmap analysis?
Store heatmap analysis shows how shoppers move through different zones of a physical store. Retail teams can use it to identify high-engagement areas, low-visibility zones, display performance, and customer flow patterns.
Why is store conversion rate important?
Store conversion rate compares visitor traffic with transactions. It helps retailers identify whether a store has a traffic challenge, a conversion challenge, or both.
How can APAC retailers use shopper intelligence responsibly?
Retailers should focus on aggregated insights, define clear operating use cases, manage data access carefully, consider privacy obligations, and avoid unsupported claims about individual identification unless approved product documentation and legal review confirm them.
Explore how xTrack helps retailers turn footfall, heatmaps, demographics, dwell time, and shopper intelligence into store-level operating decisions, with Vortex Cloud providing a unified real-time dashboard across locations.
Frequently Asked Questions
What is AI footfall analytics in retail?
AI footfall analytics in retail uses sensors, computer vision, and analytics software to measure aggregated store traffic, customer movement, dwell time, demographics, heatmaps, and conversion signals. It helps retailers understand what happens in-store before a transaction occurs.
How does footfall analytics improve store operations?
Footfall analytics helps retailers compare traffic, conversion, peak periods, zone engagement, and store performance. This can support decisions around staffing, merchandising, campaign placement, store layout, and multi-store benchmarking.
What is store heatmap analysis?
Store heatmap analysis shows how shoppers move through different zones of a physical store. Retail teams can use it to identify high-engagement areas, low-visibility zones, display performance, and customer flow patterns.
Why is store conversion rate important?
Store conversion rate compares visitor traffic with transactions. It helps retailers identify whether a store has a traffic challenge, a conversion challenge, or both.
How can APAC retailers use shopper intelligence responsibly?
Retailers should focus on aggregated insights, define clear operating use cases, manage data access carefully, consider privacy obligations, and avoid unsupported claims about individual identification unless approved product documentation and legal review confirm them.
Sources
- Singapore Department of Statistics: Monthly Retail Sales Index and Food & Beverage Services Index, June 2026
- IMDA: Retail Industry Digital Plan
- NRF: 4 essential takeaways from NRF 2026 Retail's Big Show Asia Pacific
- Grand View Research: Computer Vision AI in Retail Market
- The Business Research Company: AI-Driven Retail Heat Map Global Market Report
- Straits Research: In-Store Analytics Market
- Market Data Forecast: Asia Pacific Artificial Intelligence in Retail Market
Related Articles
Continue exploring insights from xRetail Solutions
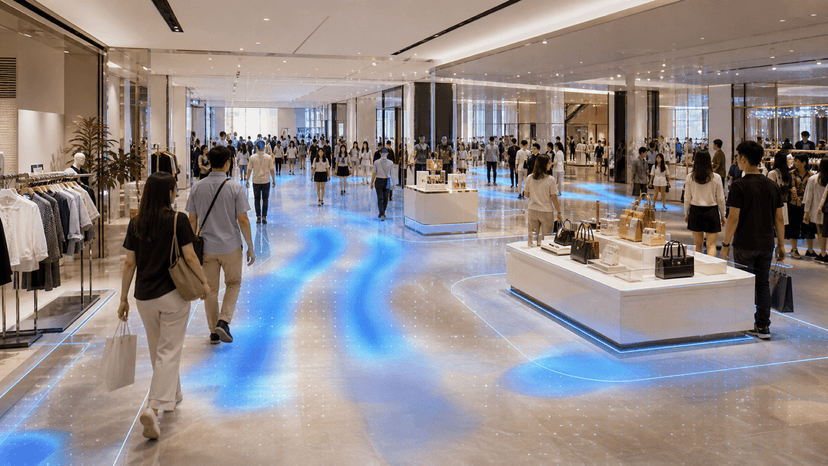
Peak Season Playbook: How Footfall Analytics Prepare APAC Retail Stores for 9.9, 11.11 and Chinese New Year
August 18, 2026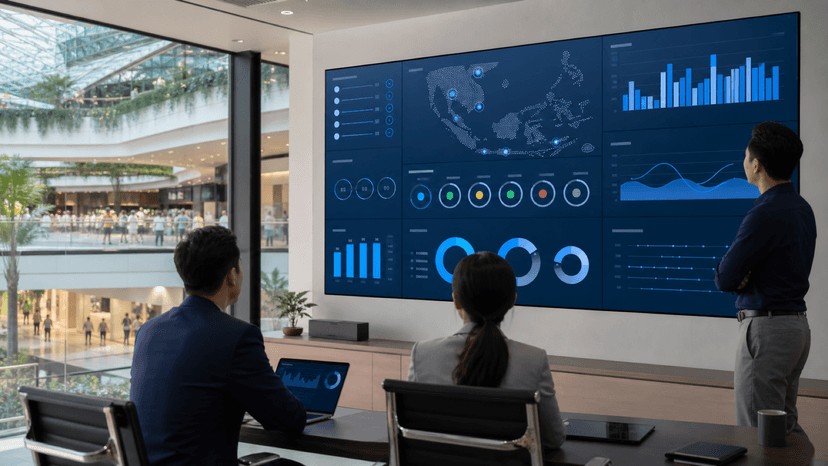
Unified Retail Operations Dashboard: Why Multi-Store Retail Teams Need Real-Time Visibility
August 13, 2026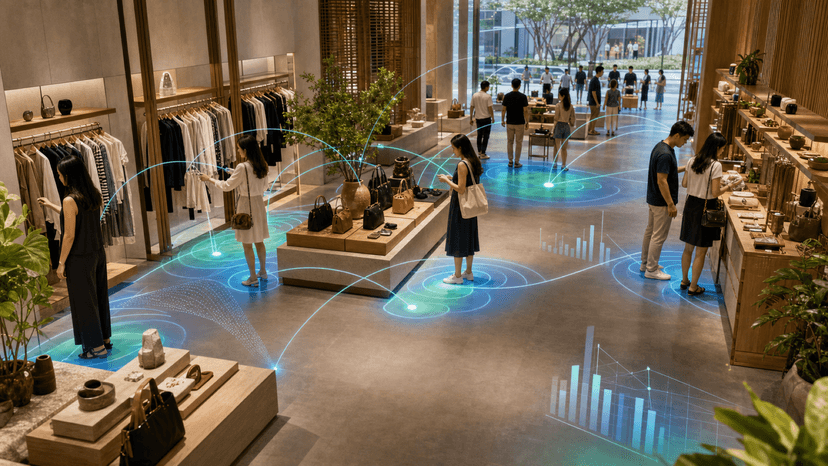
AI-Powered Store Analytics: Bridging Online and In-Store Retail Insights
July 30, 2026Ready to Transform Your Retail Operations?
Explore how xRetail Solutions connects shopper intelligence, resilient store networks, and unified operations visibility for modern retail teams.
Contact Our Team