
Peak Season Playbook: How Footfall Analytics Prepare APAC Retail Stores for 9.9, 11.11 and Chinese New Year
APAC peak seasons have become more than campaign moments. For store operations teams, they are stress tests. Footfall analytics gives retailers a practical way to prepare for 9.9, 10.10, 11.11, Black Friday, 12.12, and Chinese New Year by measuring what happens inside physical stores before, during, and after each traffic spike.
The core question is not whether a campaign created online activity. Most retailers can already see digital sales, media spend, and ecommerce engagement. The harder operational question is what happened on the shop floor. Did store visits increase? Which entrances, departments, and displays absorbed traffic? Where did dwell time concentrate? Did higher traffic translate into a stronger store conversion rate? Did staffing plans match peak occupancy and service-area pressure?
xTrack
Footfall analytics, heatmaps, dwell time, occupancy, zone engagement, shopper journey, and store conversion signals
Learn More →This is where AI shopper intelligence becomes useful. xTrack, xRetail's footfall and store analytics layer, helps retail teams measure footfall counting, people counting, heatmaps, dwell time, conversion rates, zone analysis, occupancy monitoring, and shopper journey signals. Used well, those signals turn peak season from a reactive scramble into a measurable operating cycle.
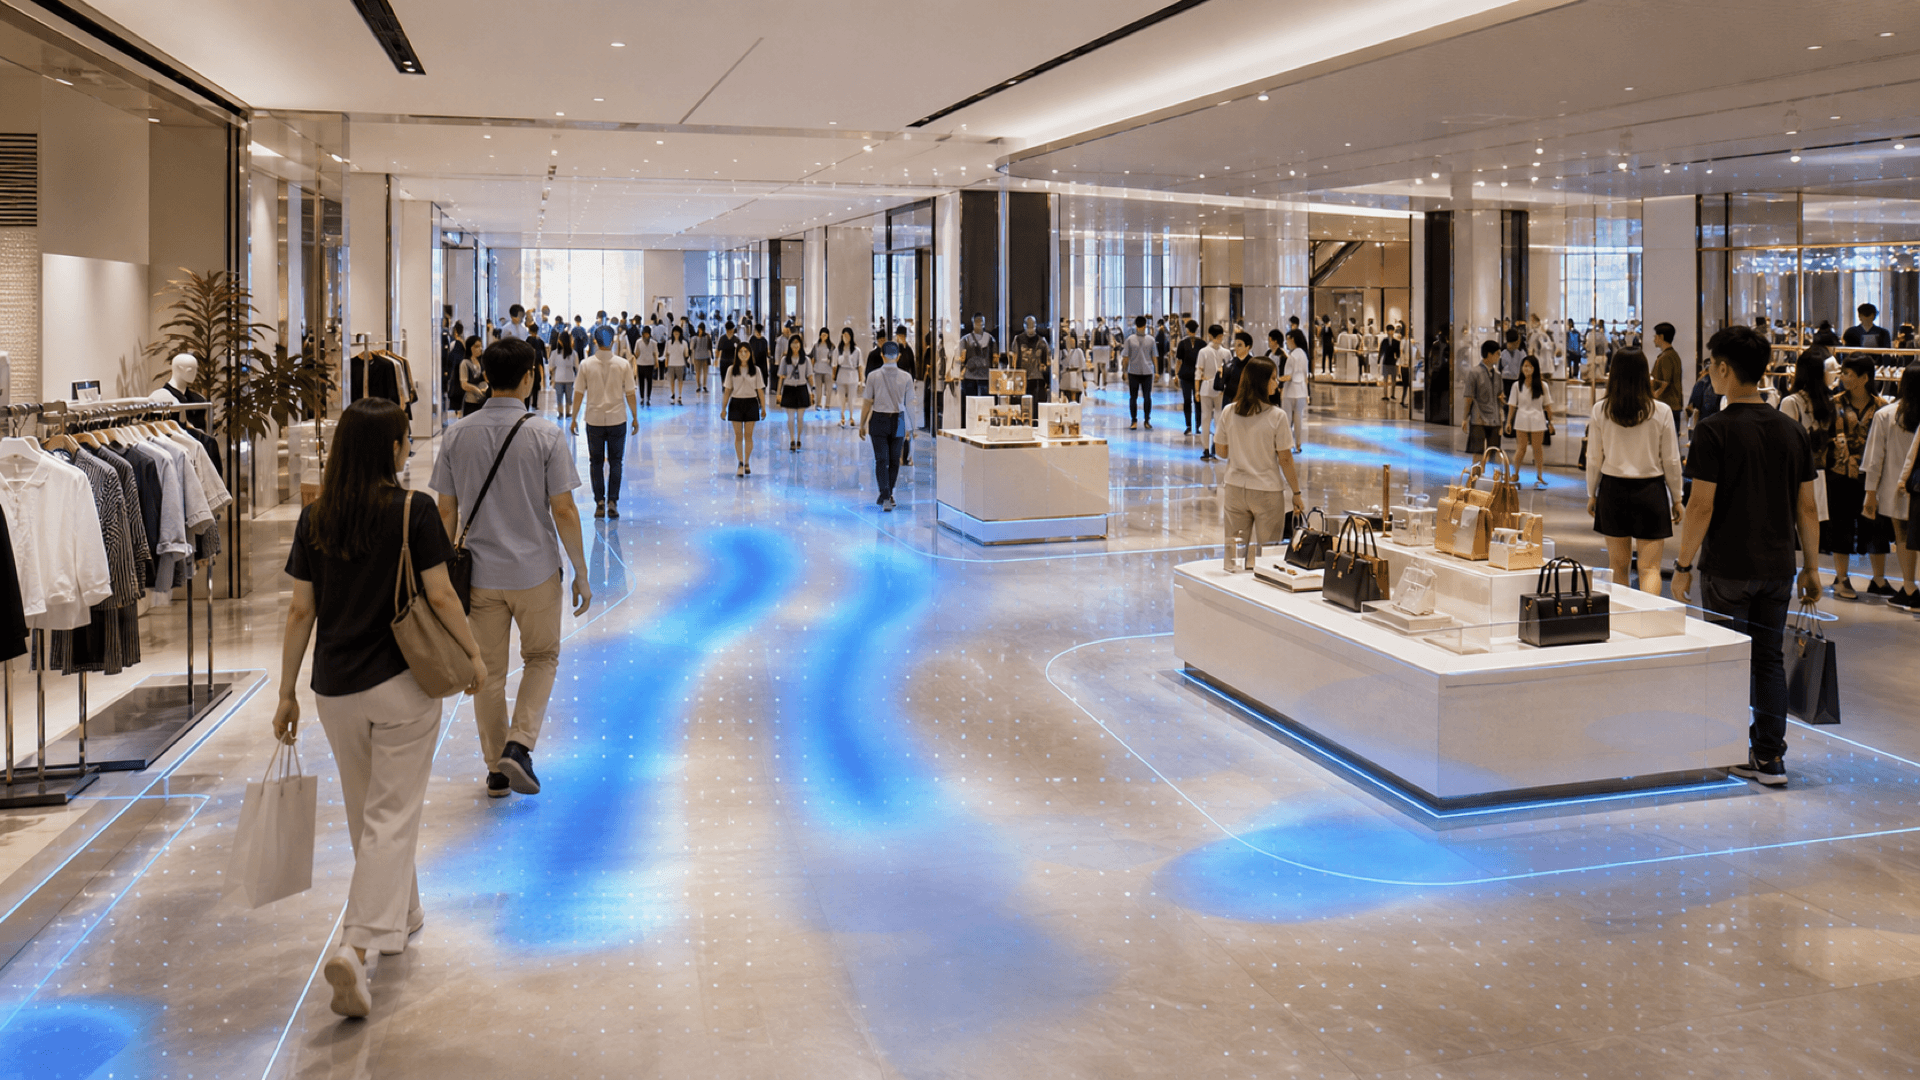
Why APAC peak seasons are now operational stress tests
Retail calendars in Singapore and Southeast Asia are no longer shaped only by traditional festive periods. Physical stores now operate around repeated demand pulses: 9.9, 10.10, 11.11, Black Friday, 12.12, school holidays, tourism periods, and Chinese New Year.
That creates volatility. Singapore retail sales data shows how strongly timing can affect year-on-year comparisons around Chinese New Year. The Singapore Department of Statistics reported that retail sales fell 3.6 percent year on year in February 2025, partly because Chinese New Year took place in January 2025 instead of February 2024. In January 2026, Retail Asia reported a 0.4 percent year-on-year fall, with timing again linked to Chinese New Year falling in February 2026 instead of January 2025. By February 2026, The Straits Times reported that Singapore retail sales rebounded 8.3 percent year on year, while sales excluding motor vehicles grew 11.2 percent, partly linked to festive spending.
For retail leaders, the lesson is straightforward: a single month can mislead. Peak readiness needs a multi-week view of traffic, conversion, and customer flow. Chinese New Year planning, for example, should not be evaluated only by comparing January with January or February with February. The operating window should include the build-up, the festive week, and the post-event normalisation period.
Platform-led shopping festivals add another layer. Google, Temasek, and Bain's e-Conomy SEA 2025 work estimates Southeast Asia's digital economy GMV at about US$305 billion in 2025, with ecommerce GMV projected at US$185 billion. Bain's release also states that video commerce accounts for about 25 percent of total ecommerce GMV in Southeast Asia. These figures show the intensity of digital discovery and purchase behaviour in the region.
But store teams should be careful with interpretation. Ecommerce intensity does not automatically prove physical store traffic lift. Shopee's 9.9 2024 release, for example, reported that Shopee Live sold 9 million products in the first three minutes of opening. Lazada's 11.11 2020 release reported more than 40 million users and 400,000 brands and sellers participating across Southeast Asia. These are useful signals of regional shopping festival scale, not evidence that any specific store saw higher footfall.
The right approach is to treat online-to-store spillover as a measurable planning question. If a retailer runs a 9.9 campaign across ecommerce, social commerce, marketplaces, and mall activations, footfall analytics can help determine whether store visits changed, where traffic moved, and whether the store converted attention into sales.
What traffic signals should retailers measure before peak season?
Peak planning often starts with sales forecasts, stock allocation, and staff rosters. Those are necessary, but incomplete. Sales data tells retailers what was purchased. It does not show how many people entered, how they moved, which zones attracted attention, or where customer flow became difficult to manage.
Before a peak period, retail teams should build a baseline across several store analytics signals.
Footfall counting
Measure visits by day, hour, entrance, and store. This helps teams understand whether the store's challenge is low traffic, uneven traffic, or high traffic that fails to convert.
People counting
Track visitor volume patterns across different operating periods. This supports staffing conversations because peak traffic rarely spreads evenly across a day.
Retail traffic analytics
Compare normal weeks with campaign build-up periods. A 9.9 or 11.11 campaign may affect store traffic before the sale date itself, especially when shoppers visit stores to inspect products before buying.
Store heatmap analysis
Identify which zones attract attention and which areas are bypassed. Heatmaps can reveal whether hero products, seasonal displays, new arrivals, or promotional bays are positioned where shoppers naturally move.
Dwell time analytics
Measure where shoppers spend time. Longer dwell can signal engagement, hesitation, product comparison, or bottlenecks depending on the zone and store format.
Store conversion rate
Compare transactions against traffic. If visits rise but conversion falls, the issue may be product availability, staffing coverage, merchandising clarity, pricing, customer flow, or campaign expectation mismatch.
Occupancy monitoring
Understand peak occupancy patterns so teams can plan for comfort, safety, staff coverage, and service-area pressure.
Shopper journey signals
Review how customers move between entrances, displays, departments, and service areas. This is especially useful in multi-zone formats such as fashion, electronics, beauty, pharmacy, supermarket, and department stores.
These signals are most useful when tracked before peak season, not only during it. Without a baseline, teams may know that a store felt busy, but not whether the campaign changed behaviour in a meaningful way.
How footfall analytics improves peak readiness
Footfall analytics is not a replacement for retail judgement. It makes that judgement more evidence-based.
For staffing, traffic patterns help managers move beyond broad assumptions. Instead of staffing only by sales history, teams can compare traffic peaks against conversion performance. If a store receives high footfall between 12pm and 2pm but conversion weakens, the issue may be coverage, product access, service-area pressure, or slow customer flow. If traffic peaks after office hours in a mall location, rosters should reflect the actual movement pattern rather than a generic retail day.
For merchandising, store heatmap analysis helps teams see whether campaign displays are placed where shoppers actually go. A seasonal table near the entrance may look prominent, but a heatmap may show stronger engagement deeper in the store or near a category wall. During 11.11 or 12.12, when price-led campaigns can pull attention quickly, retailers need to know whether key zones are absorbing traffic or being missed.
For layouts, occupancy and journey patterns can reveal congestion and bottlenecks. The goal is not simply to bring more people into the store. The goal is to help customers move, browse, and buy without unnecessary friction. If a promotional zone attracts strong dwell but also slows movement into adjacent categories, the team can adjust fixture placement, signage, product grouping, or staff presence before the next peak window.
For campaign measurement, traffic-to-sales conversion is critical. A store may report higher revenue during Chinese New Year, but without footfall analytics it is harder to separate traffic growth from conversion improvement, basket changes, or category mix. If traffic rose sharply while conversion remained flat, the campaign created attention but left operational opportunity on the table. If conversion rose while traffic stayed stable, merchandising, offer clarity, or staff engagement may have done more of the work.
For regional management, store analytics APAC teams can compare patterns across locations without assuming every market behaves the same way. A downtown Singapore store, suburban mall store, and tourist-heavy location may each respond differently to the same 9.9 or Chinese New Year campaign. The value is not one universal rule. The value is visibility into local behaviour.
A 30, 14, and 7 day readiness checklist
Peak readiness works best as a rhythm. Retailers should use each campaign to improve the next one, especially across the compressed APAC calendar from 9.9 through Chinese New Year.
30 days before peak season
Define the operating question. Are you trying to increase visits, improve store conversion rate, reduce congestion, lift engagement in specific zones, or compare stores?
Establish baseline footfall analytics by day, hour, and store.
Review last peak period performance across traffic, conversion, dwell time, and zone engagement.
Identify high-risk periods such as lunch hours, post-work peaks, weekends, payday windows, and festive shopping days.
Map campaign displays against existing heatmap patterns.
Check whether priority products are placed in zones with proven customer flow.
Align staffing plans with historical traffic, not only historical sales.
Decide how ecommerce or social commerce campaigns will be evaluated in physical stores. Treat store traffic lift as something to measure, not assume.
14 days before peak season
Review early campaign signals and compare them with the baseline.
Adjust fixtures, promotional bays, and product adjacency where heatmaps suggest low engagement.
Confirm staff coverage for expected peak occupancy periods.
Prepare store-level dashboards or reports for regional managers.
Set clear comparison windows, such as the two weeks before 9.9 versus campaign week, or Chinese New Year build-up versus festive week.
Identify stores that need closer review because traffic and conversion patterns diverge.
Brief store managers on the operational signals that matter: visits, dwell, occupancy, conversion, and zone engagement.
7 days before peak season
Confirm that footfall counting and people counting are operating correctly across priority stores.
Review opening hours, staff coverage, and display placement against latest traffic patterns.
Check customer flow through entrances, promotional zones, category areas, and service points.
Make final adjustments to signage and product grouping where shoppers may need clearer direction.
Prepare a simple daily review cadence for campaign week.
Decide who will act on insights during the event, not only who will review them afterward.
Document assumptions so the team can compare the plan with actual traffic behaviour after the campaign.
During the peak period
Track traffic by hour and store.
Watch for unexpected occupancy spikes and bottlenecks.
Compare conversion rates with traffic patterns.
Review whether hero displays and promotional zones are attracting attention.
Capture store manager observations alongside the data.
After the peak period
Compare baseline, build-up, campaign, and post-campaign periods.
Separate traffic growth from conversion change.
Review which zones gained or lost engagement.
Identify stores where traffic increased but conversion weakened.
Build the next campaign plan from observed behaviour, not memory.
What retailers should avoid claiming without verified data
Peak-season retail data is powerful, but only when interpreted carefully. Retailers should avoid overstating what the data proves.
Do not claim that ecommerce campaigns automatically increase store visits unless the retailer has measured store traffic lift or has market-specific evidence. Online discovery may influence store behaviour, especially in omnichannel retail, but the relationship should be validated.
Do not claim a fixed improvement in conversion, dwell time, staffing efficiency, or labour cost reduction unless supported by retailer-specific data. Footfall analytics helps teams measure and optimise. It does not guarantee a universal percentage outcome.
Do not treat high traffic as success by itself. A packed store with weak conversion, poor zone engagement, or uncomfortable customer flow may be underperforming despite strong visitor numbers.
Do not evaluate Chinese New Year with a single-month comparison. As Singapore retail sales data shows, festive timing can shift year-on-year patterns. Multi-week comparisons are more useful.
Do not rely only on mall-level or national retail indicators. Savills reported that Singapore retail vacancy held at 6.3 percent in Q1 2026, with well-managed malls and stable footfall supporting the market. That context matters, but each store still needs its own traffic and conversion view.
How xTrack supports a repeatable peak readiness process
xTrack helps retail teams move from anecdotal peak-season reviews to measurable store intelligence. For APAC retailers preparing for 9.9, 10.10, 11.11, Black Friday, 12.12, and Chinese New Year, the value is in repeatability.
Before the campaign, xTrack helps establish the baseline: how many people enter, when they arrive, where they move, which zones attract attention, and how long they dwell.
During the campaign, xTrack helps teams see whether assumptions are holding. If a promotion draws more traffic but creates congestion in one zone, the store can adjust layout and staff placement. If a display underperforms despite strong overall visits, the team can review placement and customer flow.
After the campaign, xTrack helps retailers compare traffic to outcomes. Store leaders can review whether higher footfall translated into a stronger store conversion rate, whether dwell time changed in priority categories, and which stores need different planning for the next event.
That makes footfall analytics a practical operating layer for peak season, not a generic technology upgrade. In a region where digital festivals and festive spending periods arrive in quick succession, the retailers that learn fastest from each traffic spike will be better prepared for the next one.
Plan your next peak season with xTrack. See how xRetail helps retail teams measure footfall, heatmaps, dwell time, occupancy, zone engagement, shopper journey, and store conversion signals across APAC locations.
Frequently Asked Questions
What is footfall analytics in retail?
Footfall analytics measures how many people enter a store, when they visit, and how traffic patterns change across locations or campaign periods. It can be combined with heatmaps, dwell time analytics, occupancy monitoring, and conversion data to support better retail operations decisions.
How can footfall analytics help during 9.9 and 11.11?
It helps retailers measure whether campaign periods affected physical store visits, which zones attracted shoppers, how dwell time changed, and whether traffic converted into sales. It is especially useful when online campaigns may influence store visits, but that impact needs to be measured rather than assumed.
Why is Chinese New Year planning different from other retail campaigns?
Chinese New Year can shift across January and February, which makes simple month-on-month or year-on-year comparisons misleading. Retailers should evaluate the build-up, festive week, and post-event period together.
Which xTrack signals are most useful for peak readiness?
Footfall counting, people counting, store heatmap analysis, dwell time analytics, conversion rates, zone analysis, occupancy monitoring, and shopper journey signals are the most relevant for this playbook.
Does xTrack identify individual shoppers?
No individual shopper identification is claimed in this article. The article frames xTrack around store-level and zone-level traffic, movement, dwell, occupancy, and conversion signals.
Sources
- Singapore Department of Statistics: Monthly Retail Sales Index and Food & Beverage Services Index, February 2025
- The Straits Times: Singapore retail sales rebound 8.3% in February on festive boost
- Retail Asia: Singapore retail sales edge down 0.4% in January
- Savills: Singapore Retail Briefing Q4 2025
- Savills: Singapore retail vacancy holds at 6.3% amid tight supply pipeline
- Google, Temasek and Bain: e-Conomy SEA 2025
- Bain: e-Conomy SEA 2025 press release
- Sensormatic Solutions: APAC holiday shopping predictions
- Retail Asia: How APAC retailers can prepare for high foot traffic during holidays
- Shopee: 9.9 Super Shopping Festival regional sales signal
- Lazada: 11.11 Shopping Festival participation benchmark
Related Articles
Continue exploring insights from xRetail Solutions
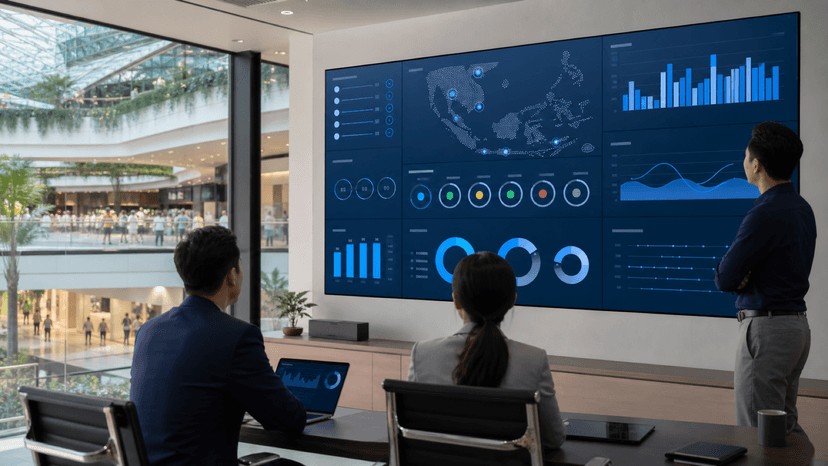
Unified Retail Operations Dashboard: Why Multi-Store Retail Teams Need Real-Time Visibility
August 13, 2026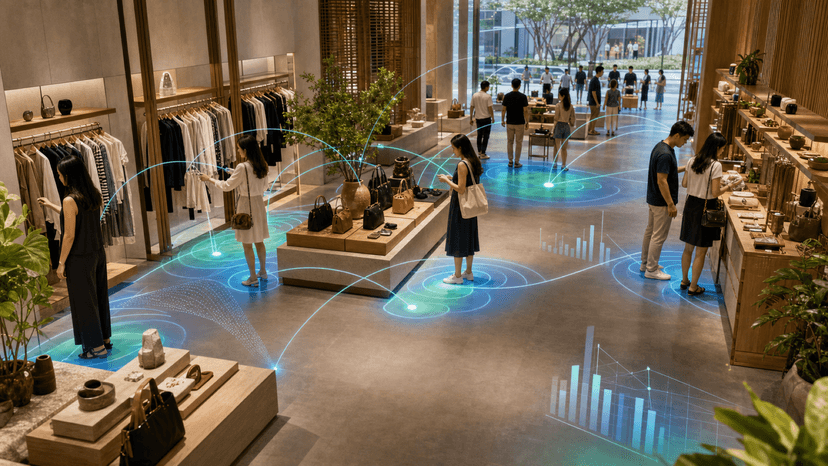
AI-Powered Store Analytics: Bridging Online and In-Store Retail Insights
July 30, 2026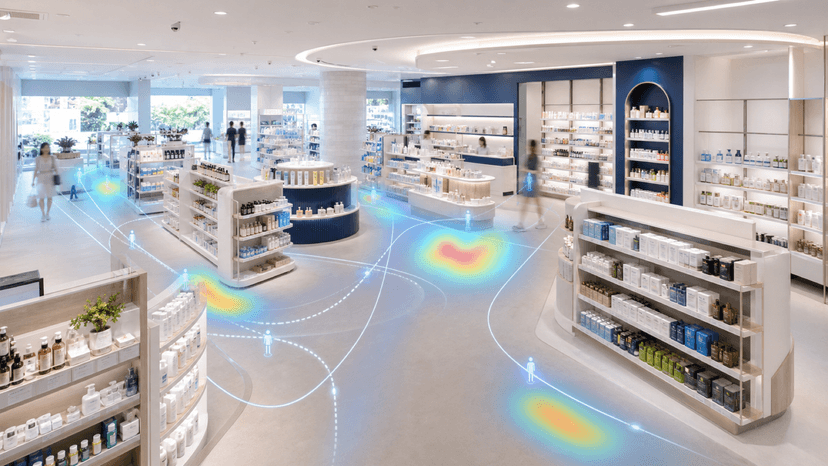
AI Footfall Analytics Retail: How APAC Stores Turn Shopper Movement Into Better Operations
August 11, 2026Ready to Transform Your Retail Operations?
Explore how xRetail Solutions connects shopper intelligence, resilient store networks, and unified operations visibility for modern retail teams.
Contact Our Team