
Unified Retail Operations Dashboard: Why Multi-Store Retail Teams Need Real-Time Visibility
Retail teams do not struggle because they lack data. They struggle because the data that matters is often scattered across sales reports, traffic counters, spreadsheets, store messages, device portals, and delayed exception reports. For a regional operations leader, the problem is not whether information exists. The problem is whether the team can see what is happening now, compare it across outlets, and act before a small issue becomes a lost trading day.
That is where a unified retail operations dashboard becomes more than a reporting tool. For multi-store retailers in Singapore and APAC, it can become the daily operating layer that connects store performance, real-time footfall data, shopper activity, device health monitoring, connectivity status, and alerts in one view.
Vortex Cloud
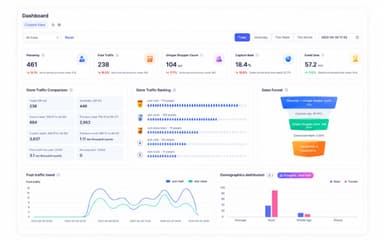
Unified real-time dashboard for store operations, shopper activity, and retail network visibility
Learn More →Vortex Cloud is positioned for this operational need. Instead of treating dashboards as passive business intelligence, retailers should think about unified visibility as an active control layer: a shared view for store, operations, and IT teams to understand what is happening across the network and respond faster.
The Visibility Problem in Multi-Store Retail
Retail operations have become more complex. A store is no longer only a sales floor with a POS terminal. It may include digital signage, traffic sensors, payment terminals, cameras, routers, IoT devices, staff devices, campaign screens, and multiple systems that report different parts of the same operating reality.
The result is fragmentation. Operations teams may review sales by outlet. Merchandising teams may look at campaign periods and product movement. IT teams may monitor connectivity and device uptime. Store managers may use messages or manual reports to explain local conditions. Each team has a partial view, but no one has the full picture in the moment.
This creates practical problems. A store with lower sales may not know whether the issue is low traffic, weaker conversion, a local service bottleneck, poor campaign visibility, or a system outage. A store with strong footfall but weak conversion needs a different response from a store with low visitor volume. A device or network issue may affect POS reliability, digital signage, or IoT reporting before head office notices the business impact.
Sales data is essential, but it is not enough. Sales tell the retailer what happened at the transaction point. Store operations visibility requires context around those transactions: how many people entered, where shoppers moved, how long they stayed, how each outlet compares, and whether the store systems were healthy enough to support trading.
Why End-of-Day Reporting Is Too Slow for Store Operations
End-of-day reporting still has value for finance, management review, and longer-term planning. It is less useful for issues that unfold during trading hours.
If footfall rises during lunch, after work, or during a weekend promotion, store teams need to know while that demand is present. If a location is seeing high traffic but low traffic-to-sales conversion, the opportunity exists now. If a store connectivity issue is unstable, the risk to POS, payment, digital signage, and IoT monitoring is immediate.
The more distributed the retail network, the more this delay matters. A regional manager responsible for 20, 50, or 100 outlets cannot rely on manual escalation for every exception. They need a multi-store analytics dashboard that highlights where attention is needed, which outlet is underperforming against comparable stores, and whether the issue appears commercial, operational, or technical.
Singapore retail data shows why timely visibility matters. According to the Singapore Department of Statistics, retail sales rose 4.0 percent year on year in June 2026, while food and beverage services declined 2.3 percent year on year. These uneven category conditions underline a familiar reality for operators: performance can shift by format, location, and trading period. A monthly or daily report may explain the trend later. Real-time visibility helps teams manage the day as it happens.
What a Unified Retail Operations Dashboard Should Show
A useful unified dashboard should not be a wall of charts. It should help teams prioritise action.
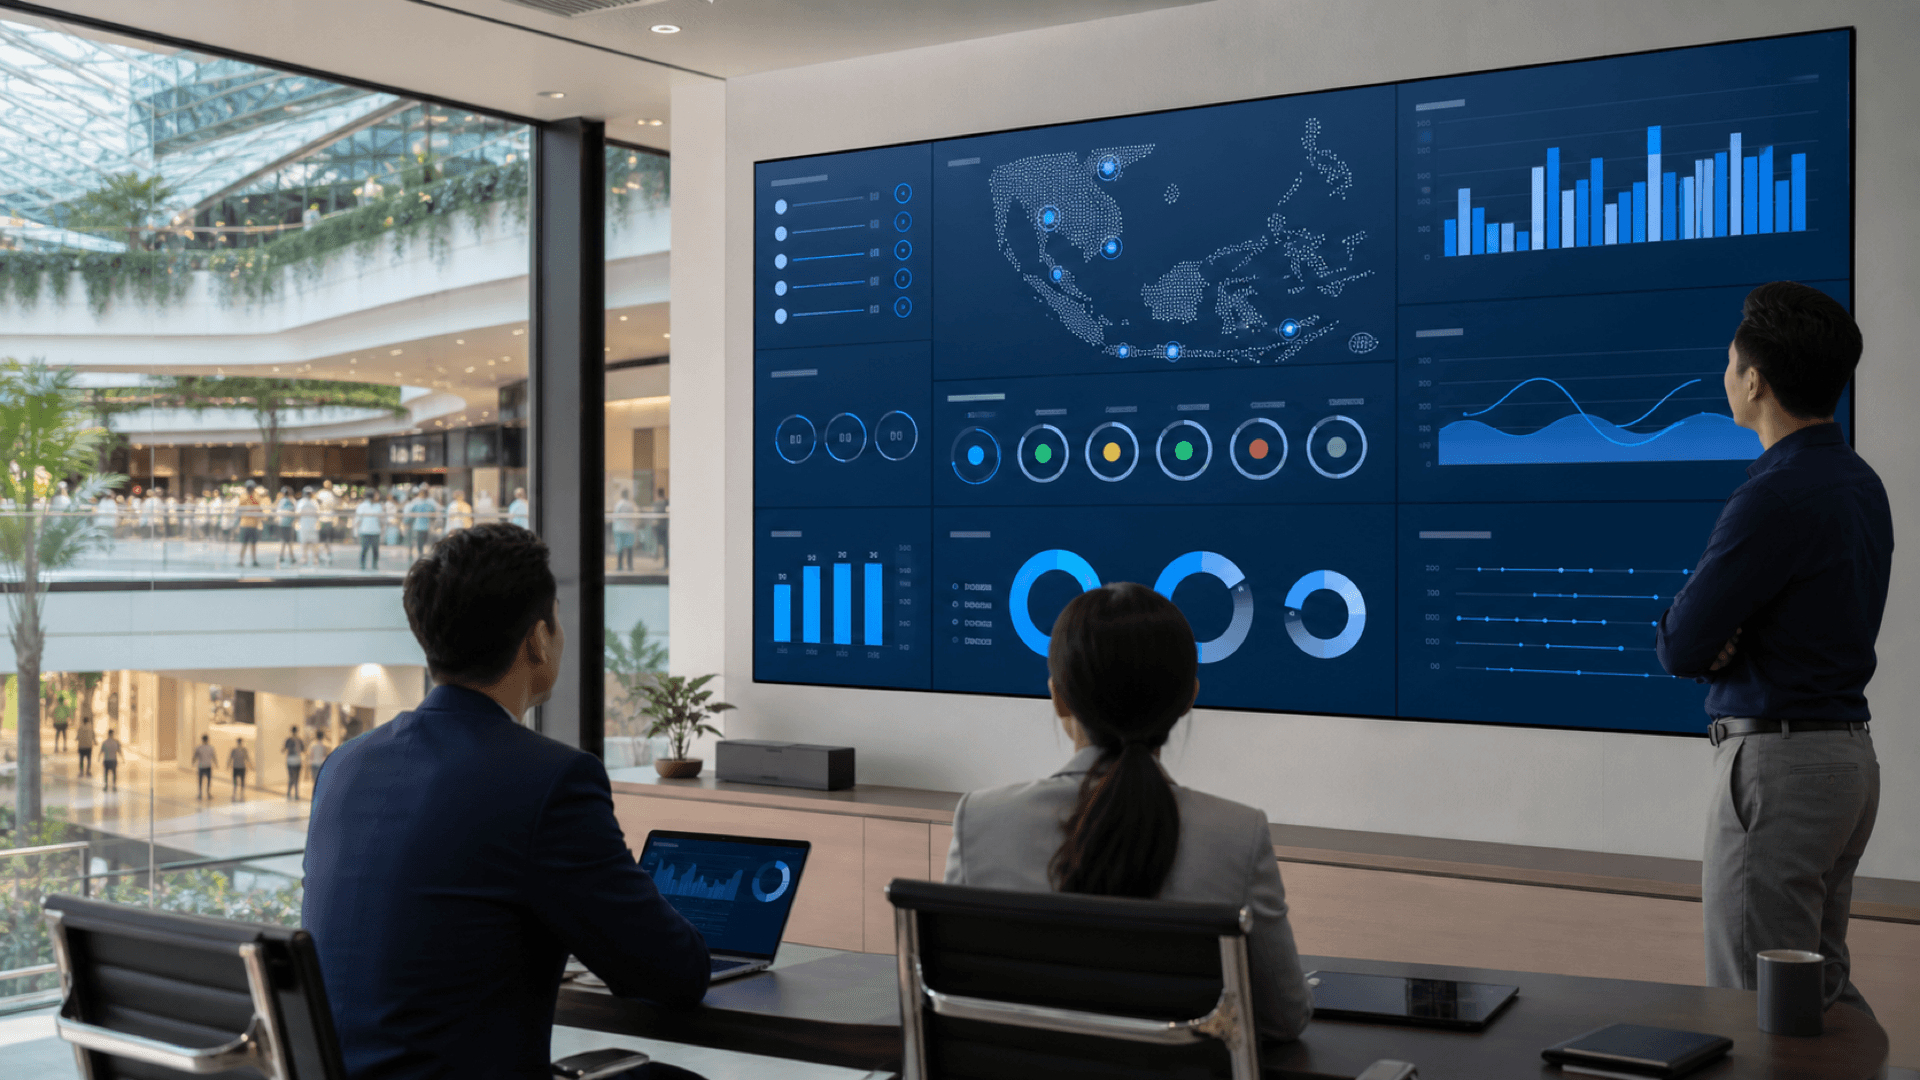
For retail operations leaders, the dashboard should bring together store performance comparison, real-time footfall data, shopper activity, device health monitoring, connectivity status, alerts, and multi-outlet management. The key is not simply adding more metrics. The key is connecting metrics that explain one another.
For example, a store with declining sales and declining footfall may need a different response from a store with stable footfall and lower conversion. A store with high dwell time but weak conversion may need layout, staffing, product, or campaign review. A store with unstable device health may require IT action before commercial teams misread the performance data.
This is where a unified retail operations dashboard should support better operating conversations. Instead of asking why sales fell yesterday, teams can ask which stores need attention now, and what the data suggests is driving the issue.
Why Footfall Analytics Belongs in the Operating View
Footfall analytics gives retail teams the missing context behind sales performance.
Many retailers know what sold, but not how many people walked in, which zones attracted attention, how long shoppers stayed, or whether traffic was aligned with staffing and campaign activity. Without that context, store performance reviews can become guesswork.
xTrack supports this layer through AI shopper intelligence, including footfall, heatmaps, dwell time, and shopper behaviour analytics. Used carefully, these signals help retailers understand customer flow inside each outlet while avoiding over-reliance on sales data alone.
In an operating dashboard, footfall analytics can help answer practical questions. Is a sales decline caused by fewer visitors or weaker conversion? Which outlets attract traffic but fail to convert at the expected level? Which store zones receive attention, and which are being missed? Are peak traffic periods aligned with staffing plans? Did a campaign increase shopper activity in the intended area?
For Singapore and APAC retailers operating across malls, high streets, transport nodes, mixed-use developments, and neighbourhood locations, these questions matter. Stores may share the same brand and product mix, but shopper behaviour can vary significantly by catchment, daypart, and local context.
Why Network and Device Health Belong Beside Store Performance
Retail operations visibility should not stop at customer and sales metrics. Modern stores depend on connected infrastructure.
If the store network is unstable, the impact can appear in many ways: POS issues, payment friction, digital signage downtime, IoT reporting gaps, or delayed visibility into store conditions. For operations leaders, this is not only an IT concern. It affects the customer experience and the reliability of the operating data itself.
xPilot 3 Pro supports the connectivity side of the retail environment as a 5G failover gateway with multi-WAN failover, Wi-Fi 6 capability, and remote management use cases for retail networks. In a unified dashboard context, this type of connectivity status helps IT and operations teams share the same view of store resilience.
The practical value is alignment. If a store performance change appears while device health and connectivity remain normal, the operations team can focus on traffic, conversion, staffing, merchandising, or campaign factors. If performance changes appear alongside network instability or device issues, IT can investigate quickly instead of waiting for a store-level complaint.
This is why device health monitoring and retail IoT monitoring belong near store performance data. The store is one operating environment. The dashboard should reflect that.
Singapore and APAC Retail Teams Need Faster Operating Visibility
The regional context strengthens the case for unified dashboards.
Singapore refreshed its Retail Industry Digital Plan through EnterpriseSG and IMDA to help more than 2,000 SME retailers adopt AI and retail technologies. The refresh responds to rising costs, manpower constraints, and competition, and it reorganises digital solutions around end-to-end retail operations. That direction matters because retailers are thinking less about isolated technology purchases and more about connected operating capabilities across front-of-house, back-of-house, and corporate teams.
The Business Times reported that IMDA said nine in 10 retail SMEs reported productivity gains from digital adoption in 2025. Global retail research points in the same direction. Deloitte 2026 retail research says 96 percent of surveyed retail executives expect revenue growth and 81 percent expect margin expansion, while operational excellence and data-driven insights remain core fundamentals.
IDC has also argued that many retail and restaurant organisations still operate on data foundations not built for real-time decision-making or intelligent automation, and that synchronised, accessible data is foundational because local store conditions can change by hour and location.
For APAC retail networks, these pressures are amplified by store diversity. A retailer may operate flagship stores, mall outlets, smaller neighbourhood formats, pop-ups, and regional stores across different markets. A static report cannot easily show which outlet needs attention first. A unified store KPI dashboard can.
Evaluation Checklist for Retail Teams
When evaluating a unified retail operations dashboard, retail and IT leaders should avoid starting with chart volume. A dashboard with more widgets is not automatically more useful. Start with operating decisions.
Retail teams should ask whether the dashboard compares performance across stores in a way that highlights outliers, connects sales outcomes with footfall and dwell time, shows real-time footfall data by outlet and time period, supports store heatmap analysis where relevant, surfaces device health and connectivity status, and provides alerts that help teams act during trading hours.
They should also check whether head office and store teams can use the same source of truth without manual consolidation, whether regional teams can manage multiple outlets from one view, whether the system helps separate commercial issues from infrastructure issues, and whether the data is presented clearly enough for daily use rather than analyst review only.
The best dashboard is not the one that looks most technical. It is the one that helps teams decide faster, coordinate better, and understand what is really happening inside the store network.
How Vortex Cloud Fits the Retail Operating Layer
Vortex Cloud should be positioned as xRetail unified operations dashboard for modern retail chains. It brings the Vortex Cloud story together with xTrack and xPilot 3 Pro: store performance visibility, shopper intelligence, and connectivity resilience in one retail operations narrative.
For buyers, the core message is straightforward: sales data alone does not explain store performance. A retail operations team needs one operating view that connects shopper activity, outlet comparison, alerts, device health, and network status.
This is the buyer-facing value of Vortex Cloud. It helps retail leaders move from delayed reporting to real-time store operations visibility. It gives operations and IT teams a clearer shared view of what is happening across every outlet. It helps regional leaders compare stores, detect exceptions, and focus attention where it matters.
The product-specific wording should remain careful until final feature names and customer-facing UI modules are confirmed. The article can confidently describe Vortex Cloud as a unified operations dashboard and cloud retail platform based on current public positioning. It should avoid claiming exact modules, alert categories, export options, or role permissions unless those details are verified by xRetail.
Modern retail chains need store operations visibility at the speed of ecommerce. Vortex Cloud gives operations teams one real-time view across store performance, shopper activity, and network health so they can manage outlets with greater clarity.
See how Vortex Cloud gives your operations team one real-time view of store performance, shopper activity, and network status across every outlet.
Frequently Asked Questions
What is a unified retail operations dashboard?
A unified retail operations dashboard is a shared operating view that brings together store performance, footfall analytics, store comparison, device health monitoring, connectivity status, and alerts across multiple outlets.
Why is sales data alone not enough for store operations?
Sales data shows what happened at the transaction point, but it does not explain visitor volume, shopper movement, dwell time, conversion opportunities, or technical issues that may affect store performance.
How does footfall analytics support retail operations?
Footfall analytics helps retailers understand how many people enter a store, when traffic peaks, where shoppers move, how long they stay, and whether traffic is converting into sales.
Why should network status appear in a retail operations dashboard?
Store connectivity affects POS reliability, payment experiences, digital signage, IoT reporting, and device uptime. Including network status helps operations and IT teams separate commercial issues from infrastructure issues.
Is this relevant for Singapore and APAC retailers?
Yes. Singapore and APAC retailers often manage diverse store formats, uneven category conditions, manpower constraints, and regional operating complexity. A unified dashboard helps teams compare outlets and respond faster.
Sources
- Singapore Department of Statistics: Monthly Retail Sales Index and Food & Beverage Services Index, June 2026
- The Business Times: EnterpriseSG and IMDA launch refreshed Retail Industry Digital Plan
- IMDA: Retail Industry Digital Plan
- Deloitte: 2026 Retail Industry Global Outlook
- IDC: Retail and restaurant AI investments need data modernization
Related Articles
Continue exploring insights from xRetail Solutions
Peak Season Playbook: How Footfall Analytics Prepare APAC Retail Stores for 9.9, 11.11 and Chinese New Year
August 18, 2026
AI-Powered Store Analytics: Bridging Online and In-Store Retail Insights
July 30, 2026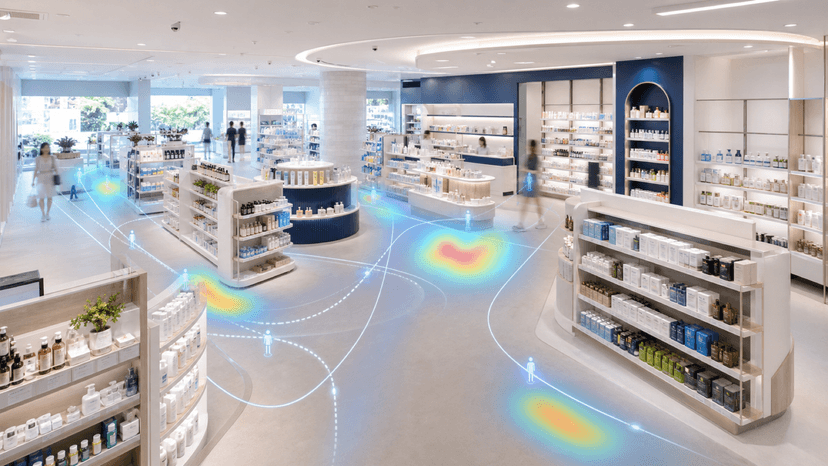
AI Footfall Analytics Retail: How APAC Stores Turn Shopper Movement Into Better Operations
August 11, 2026Ready to Transform Your Retail Operations?
Explore how xRetail Solutions connects shopper intelligence, resilient store networks, and unified operations visibility for modern retail teams.
Contact Our Team