Why Retail Dashboards Fail: The Vortex Cloud Approach to Multi-Store Visibility
A retail chain with 30 stores in Singapore typically uses three to five separate systems to manage daily operations. One for footfall analytics. Another for network monitoring. A third for POS data. A fourth for security cameras. And sometimes a fifth for device health and remote diagnostics. Each system has its own login, its own alerting rules, and its own support team. None of them talk to each other.
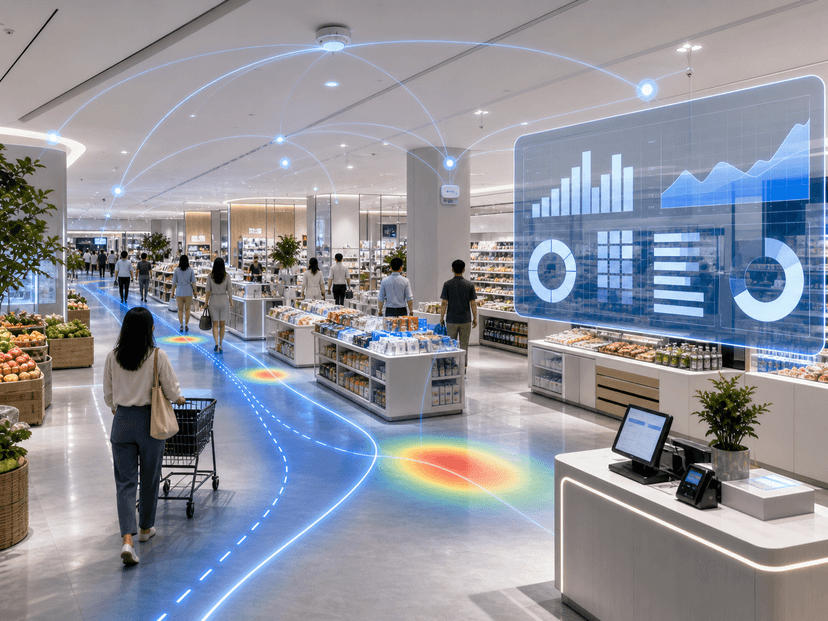
This fragmented approach creates a problem that no single dashboard can solve: blind spots between systems. When footfall drops at a flagship store, the analytics dashboard shows the decline. But it does not show that the network went down for 15 minutes during the lunch rush, or that the POS terminal was offline during the same period. The correlation between these events is invisible unless someone manually pulls data from three different platforms and overlays them on a spreadsheet.

Vortex Cloud
Unified operations dashboard for multi-store retail chains
Learn More →Unified operations platforms exist specifically to close these gaps. Vortex Cloud aggregates data from footfall analytics, network connectivity, device health, and operational alerts into a single view. When something goes wrong, the platform shows not just what happened, but what else happened at the same time.
The Cost of Fragmented Visibility
The operational cost of running separate systems is higher than most retail teams realise. Each platform requires separate training for store managers and regional supervisors. Each generates its own alert noise, and the team quickly learns to ignore alerts from all of them because most are false positives triggered by a single system in isolation.
More importantly, fragmented visibility delays response time. When a store manager notices footfall is down and calls the IT team to check the network, the IT team opens a different dashboard to verify. By the time the issue is confirmed, the lunch rush is over and the data is already lost. A unified platform detects the network drop and the footfall decline simultaneously, correlates them automatically, and surfaces the root cause without a phone call.
What a Unified Operations View Actually Shows
A single operations dashboard for a retail chain with multiple locations delivers three categories of data that separate systems cannot provide:
Cross-system correlations: When the payment terminal at a Jurong store drops offline at 18:30 on a Friday, a unified platform can immediately check whether the store gateway also lost connectivity, whether the failover activated, and whether footfall during that period was affected. Three data streams processed together produce an answer in seconds instead of hours of investigation.
Store health at a glance: A regional supervisor responsible for 10 stores should not need to log into 10 instances of the same dashboard. A unified view shows every store on one screen, with health status indicators that combine connectivity, device uptime, footfall trends, and alert history into a single green-yellow-red signal. Stores with active issues are visible immediately without drilling into each location.
Historical trend baselines: When a store is performing below expectation, the question is whether the decline started gradually or was triggered by a specific event. Unified platforms retain correlated data over time, so a retail operations manager can see that footfall softness began on the same day a router firmware update was pushed, for example, and investigate the connection.
The Infrastructure Requirement
Unified operations platforms require that the underlying hardware is designed to report data in a standardised format. This is straightforward when all store devices come from the same ecosystem: gateways, cameras, and sensors that communicate through a common management layer.
xPilot gateways serve as this common layer. Every device connected to an xPilot gateway — cameras, POS terminals, digital signage, environmental sensors — reports its status through the same management interface. Vortex Cloud collects these status reports alongside footfall analytics from xTrack cameras, presenting everything in a single dashboard that refreshes in real time.
For retail chains evaluating operations platforms, compatibility with existing hardware is worth checking early. Platforms that require replacing all store infrastructure add years to the deployment timeline. Platforms that layer on top of existing gateways and sensors can go live in weeks, not quarters.
From Dashboard to Decision
The value of a unified operations view is not in the dashboard itself. It is in the decisions the dashboard enables. A regional manager who can see that Store A has declining footfall and a failing air conditioning unit on the same screen can prioritise the maintenance visit over cosmetic updates at Store B, where footfall is stable and all systems are healthy.
An IT team that receives a correlated alert — network dropped, failover activated, footfall unaffected — can classify the issue as non-critical and resolve it during the next maintenance window instead of dispatching a technician immediately. An alert that footfall dropped 40% while the network remained stable requires a different response entirely: the problem is likely merchandising, staffing, or a local event, not infrastructure.
This ability to triage incidents based on correlated data is what separates a unified platform from a collection of dashboards. One shows data. The other shows context.
Getting Started
Retail chains that want to consolidate their operations monitoring typically start with a pilot across three to five stores. Vortex Cloud deployment does not require changes to existing network infrastructure or camera hardware when xPilot gateways and xTrack cameras are already in place. The dashboard populates with live data within hours of connecting the first devices.
The pilot phase is used to calibrate alert thresholds across systems, establish cross-system correlation rules, and train regional staff on the unified view. Once the pilot demonstrates the time savings and reduction in manual investigation work, the rollout expands to the full chain.
To learn more about how Vortex Cloud consolidates store operations monitoring into a single dashboard, book a pilot or visit the Vortex Cloud product page.
Related Articles
Continue exploring insights from xRetail
Why Smart Stores Need More Than Analytics: The Case for a Connected Retail Operations Stack
July 3, 2026
Data to Action: How Singapore Retail Chains Turn Footfall into Insights
July 3, 2026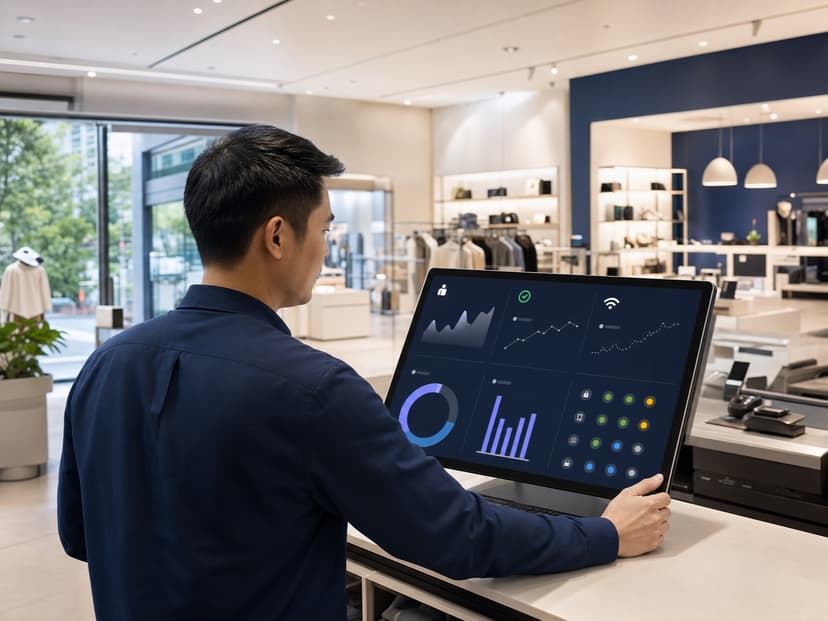
Operational Data Integration Is the Missing Layer in Retail AI Adoption
July 3, 2026Ready to Transform Your Retail Operations?
Discover how xRetail\' AI-powered IoT management and shopper analytics platforms can help your business reduce costs, increase revenue, and stay ahead of the competition.
Contact Our Team